The SQL Profiler is not available in the Basic version of DB Optimizer.
SQL Profiler samples a data source and builds a statistical model of the load on the database. Profiling is used to locate and diagnose problematic SQL code and event-based bottlenecks. Profiler also enables you to investigate execution and wait time event details for individual stored routines. Results are presented in the profiling editor, where you can identify problem areas and view individual SQL statements, as needed.
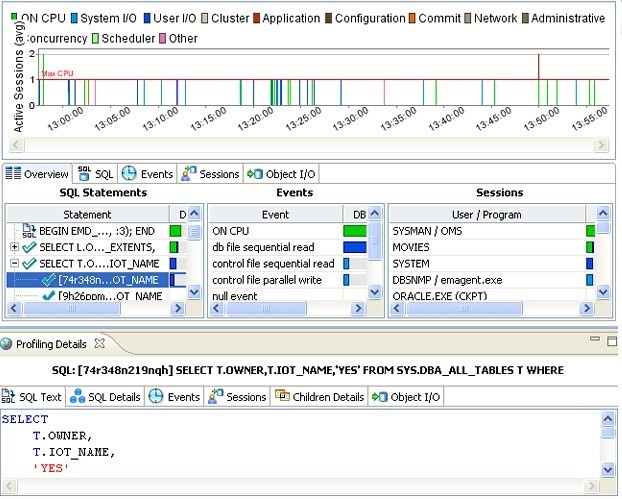
SQL Profiler is composed of the following diagnostic parts:
- The Load Graph provides a display of the overall load on the system. The bars represent individual aspects of the data source.
- The Top Activity section displays where the load originates. Tabs available in this section differ by platform, but typically available are the top SQL statements, the top events the database spends time in, and the top activity sessions that may be causing issues in terms of query time and response.
- The Profiling Details View displays detailed information for any item selected from Top Activity. For example, examining a SQL statement from Top Activity displays the identification parameters and the execution statistics of that specific statement selection.