The Profiling Details view displays detailed information on any item selected in the Top Section View, such as an SQL statement, an Event, a Session or a Procedure.
Depending on the data source platform you have specified, the tabs that appear in the view will be different, in order to accommodate the parameter specifics of the statement you have selected.
Depending on the top activity selected and the profiled platform types, some tabs may not be available.
Statement selected
When a Statement is selected, the following Profile Detail tabs are available.
| Tab Name | Description | Supported Platform | |||
|---|---|---|---|---|---|
| Oracle | Sybase | DB2 | SQL Server | ||
| SQL Text | Displays the full code of the selected SQL statement. | Yes | Yes | Yes | Yes |
| SQL Details | Provides details on statement, like execution statistics. | Yes | No | Yes | No |
| Events | Provides database activity details about events the statement is associated with. | Yes | Yes | Yes | Yes |
| Sessions | Shows which sessions executed this statement. | Yes | Yes | Yes | Yes |
| Blockers | Shows which sessions held blocking locks against the session associated with this statement. | Yes | No | No | No |
| Children Details | Lists all copies of the cursor or SQL query, if Oracle has cached multiple copies of the same statement. | Yes | No | No | No |
| Object I/O | If the SQL query has done physical I/O, then these are the objects, such as tables, and indexes that were read to satisfy the query. Temporary objects with not have values in Object and Type columns. | Yes | No | No | No |
| Procedures | Shows which procedures contain the selected statement. | No | Yes | No | Yes |
| Bind Variable Details | Shows bind variable information for SQL captured during the Profiling session. | Yes | No | No | No |
Event selected
When an Event is selected, the following Profile Detail tabs are available.
| Tab Name | Description | Supported Platform | |||
|---|---|---|---|---|---|
| Oracle | Sybase | DB2 | SQL Server | ||
| SQL | Shows which SQL statements waited on this event. | Yes | Yes | Yes | Yes |
| Sessions | Provides information about the sessions associated with the event. | Yes | Yes | Yes | Yes |
| Blockers | Shows which sessions held blocking locks against the session associated with this event. | Yes | No | No | No |
| Procedures | Shows which procedures contain the selected event. | No | Yes | No | Yes |
| Raw Data | Raw data that was sampled from the database, specifically the following:
| Yes | No | No | No |
| Analysis | Displays for "buffer busy waits" and "cache buffer chains latch" waits. The analysis shows data and documentation to assist in solving these bottlenecks. | Yes | No | No | No |
Session selected
When a Session is selected, the following Profile Detail tabs are available.
| Tab Name | Description | Supported Platforms | |||
|---|---|---|---|---|---|
| Oracle | Sybase | DB2 | SQL Server | ||
| Sessions | Provides parameters regarding the session. For example, database server connection information, and data regarding the client tool and application. | Yes | Yes | No | Yes |
| Blockers | Shows which sessions held blocking locks while this session was active. | Yes | No | No | No |
| SQL | Shows which SQL statements this session ran. | Yes | Yes | Yes | Yes |
| Events | Shows which events this session waited on. | Yes | Yes | Yes | Yes |
| Procedures | Shows which procedures ran the selected session. | No | Yes | No | Yes |
When right-clicking on a SQL statement in the Top Activity Section in Profiling, if the SQL statement is run by a different user than the user who is running DBO, than the User Mismatch dialog appears, with an example of the following message: “This query was executed by [SOE] and you are currently connected as [system]. We recommend you reconnect as [SOE] to tune the SQL. Would you like to continue anyway?” This message indicates that the statement is being tuned by a user other than the user who originally ran the query, and tables may be missing based on the different schemas. Click OK to run the query, or click Cancel and run tuning under the original user.
Blocking Session selected
When a Blocking Session is selected, the following Profiling Detail tabs are available.
| Tab Name | Description | Supported Platform | |||
|---|---|---|---|---|---|
| Oracle | Sybase | DB2 | SQL Server | ||
| Blocked Sessions | Provides identifier and V$SESSION session information on the sessions being locked by the blocking session. | Yes | No | No | No |
| Session Details | Provides parameters regarding the session. For example, database server connection information, and data regarding the client tool and application. | Yes | No | No | No |
| SQL | Shows the SQL statements associated with the lock. | Yes | No | No | No |
| Events | Shows which events the blocking session waited on. | Yes | No | No | No |
Procedure selected
When a Procedure is selected, the following Profile Detail tabs are available.
| Tab Name | Description | Supported Platform | |||
|---|---|---|---|---|---|
| Oracle | Sybase | DB2 | SQL Server | ||
| SQL Text | Shows the SQL text of the selected procedure. | No | Yes | No | Yes |
| SQL | Shows which SQL statements this procedure ran. | No | Yes | No | Yes |
| Events | Shows which events the selected procedure waited on. | No | Yes | No | Yes |
| Sessions | Provides parameters regarding the session. For example, database server connection information, and data regarding the client tool and application. | No | Yes | No | Yes |
This section also addresses the following topics:
- Viewing Details on the SQL Tab
- Viewing Details on the Sessions Tab
- Viewing Details on the Events Tab
- Viewing Details on the Procedures Tab
Viewing details on the SQL tab
In the Top Activity Session, selecting a statement entry on the SQL tab displays information in the Profiling Details view. The graph portion and details on the event category tabs on the new editor pertain only to the selected statement. Additionally, new tabs become available:
- SQL Text tab: Shows the full code of the SQL statement. For more information, see SQL Text.
- SQL Details tab: Displays execution details. This tab is only displayed for Oracle data sources. For more information, see SQL Details.
- Events tab: Displays information about the events the selected statement is associated with.
For more information, see Events.
- Sessions tab: Displays information about the sessions that the selected statement is associated with. This tab is displayed only for Oracle data sources. For more information, see Sessions.
- Procedures tab: Displays information about the procedures that contain the selected statement. This tab is displayed only for SQL Server and Sybase data sources. For more information, see Procedures.
To select a SQL tab statement entry
- On the SQL tab, click on a statement with no child nodes or on a leaf node in the statement structure.
The new profiling editor page opens, as reflected by the bread crumb trail at the top left of the editor. You can continue to drill down into the statement, as needed.
SQL Text
The SQL Text tab displays the full code of the SQL statement.
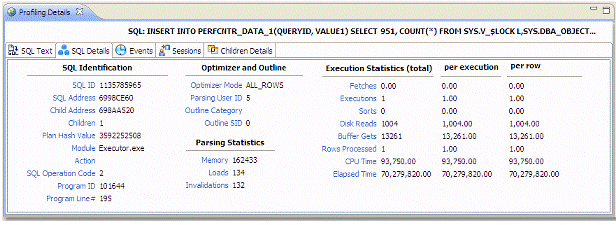
SQL Details
The SQL Details tab provides information and the execution of the statement and other information related to how it is running. It is only applicable to Oracle data sources:
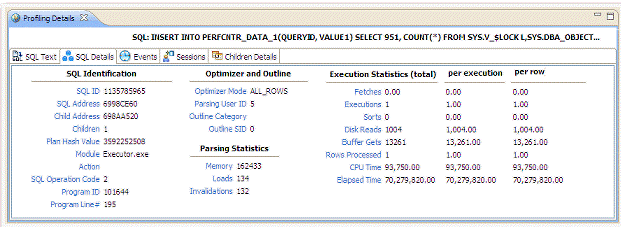
SQL Details include:
| Parameters | Description |
|---|---|
| SQL Identification Values | The SQL ID value of the statement. |
| Optimizer and Outline Values | Optimizer-specific values pertaining to the parsing user ID value and outline SID. |
| Parsing Statistics | Information regarding memory, loads, and invalidation values. |
| Execution Statistics | The execution statistics of the statement. This category includes disk reads, buffer gets, rows, and values that represent CPU and elapsed time. |
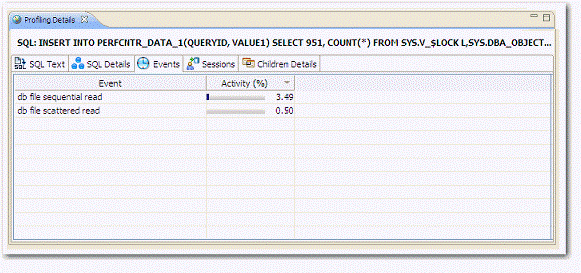
Events
The Events tab provides details about the events that the statement is associated with.
Sessions
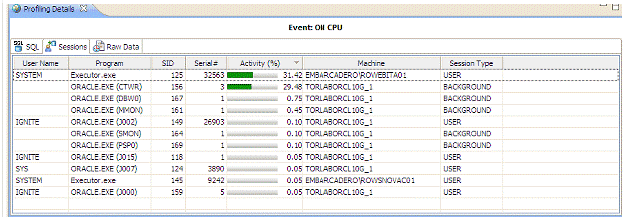
The Sessions tab provides information about any sessions the statement is associated with:
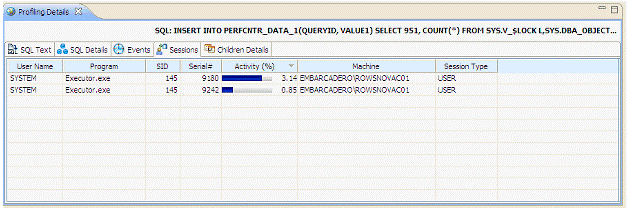
Session details include information on different parameters, depending on the platform. For example, on Oracle platforms, the following parameters are displayed: User Name, Program, SID, Serial #, Activity (%), Network Machine Name, and Session Type.
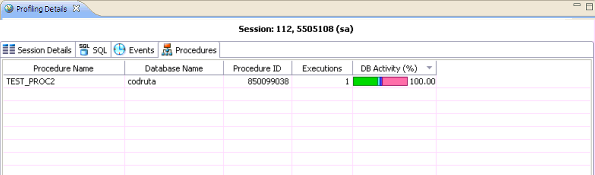
Procedures
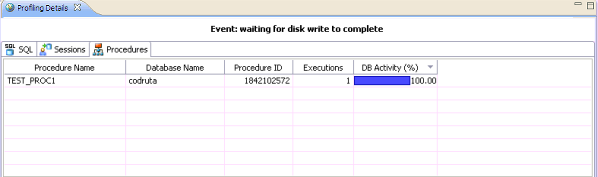
The Procedures tab provides information about any procedures containing the selected statement.
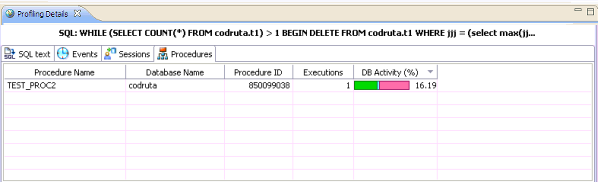
The following parameters are displayed on the Procedures tab:
| Value | Description |
|---|---|
| Procedure Name | The name of the procedure that contains the selected statement. |
| Database Name | The name of the database where the procedure resides. |
| Procedure ID | The unique ID value of the file where the specified procedure resides. |
| Executions | The number of times the procedure was executed. |
| DB Activity (%) | Use the color chart on the right-hand side of the Procedures tab to view the procedures load on the data source during the profiling session. |
Viewing details on the Sessions tab
In the Top Activities Section, selecting a statement entry on the Sessions tab displays information in the Profiling Details view. The graph portion and details on the event category tabs on the new editor pertain only to the selected statement. Additionally, new tabs become available.
Selecting an event type entry on an event category tab opens a new profiling editor page. The graph portion and details on the Sessions tab and event category tabs on the new editor page pertain only to the selected wait event and to SQL statements that waited in that event.
- Session Details tab: Shows system details about the selected session. For more information, see Session Details.
- SQL tab: Displays information about the SQL files that the selected session is associated with. This tab only appears on Oracle platforms. For more information, see SQL.
- Events tab: Displays the time and parameter information about the selected session. For more information, see Events.
- Procedures tab: Displays the details of any procedures run in the selected session. For SQL Server and Sybase data sources only. For more information, see Procedures.
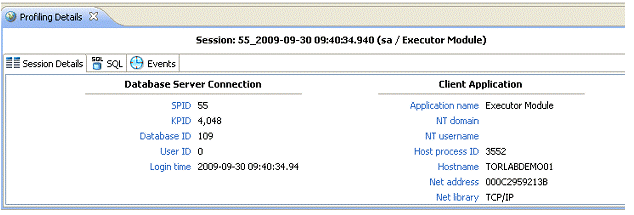
Session Details
The Session tab provides further information about the selected session. The following are examples of the session details provided for different platforms.
The fields that display vary depending on the database platform.
Oracle profiling details

Microsoft SQL Server
SQL
The SQL tab displays information about the statements associated with the session.
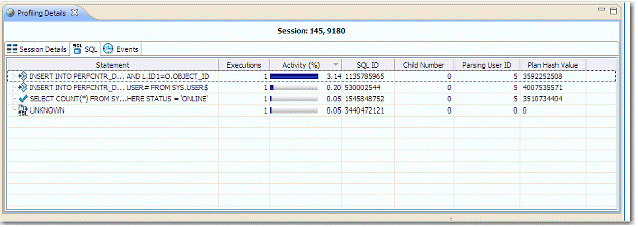
SQL statements are listed by the following parameters:
| Value | Notes |
|---|---|
| Statement | The name of the statement. |
| Executions | The number of times the statement was executed during the session. |
| Activity (%) | A graphical representation of the distribution of execution and wait time for the statement or statement component. |
| SQL ID | The SQL ID value of the statement. |
| Child Number | The child number in the database. |
| Parsing User ID | The ID of the user who parsed the statement. Plan Hash ValueThe execution value of the statement. |
| Plan Hash Value | The execution value of the statement. |
Events
The Events tab provides details about the events that the session is associated with.
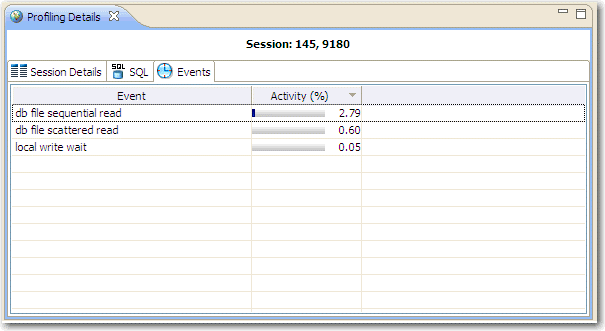
Events are listed by the following values:
| Value | Notes |
|---|---|
| Event Name | The name of the event. |
| Activity (%) | A graphical representation of the distribution of execution and wait time for the statement or statement component. |
Procedures
For SQL Server and Sybase data sources only, the Procedures tab provides details about the procedures that the session is associated with
The following parameters are displayed on the Procedures tab:
| Value | Description |
|---|---|
| Procedure Name | The name of the procedure that ran during the selected session. |
| Database Name | The name of the database where the procedure resides. |
| Procedure ID | The unique ID value of the file where the specified procedure resides. |
| Executions | The number of times the procedure was executed during the session. |
| DB Activity (%) | Use the color chart on the right-hand side of the Procedures tab to view the procedures load on the data source during the profiling session. |
Bind Variable details
For Oracle data sources, profiling captures the bind variables and their attributes. Select an SQL statement in the Profiling Session and the details of the captured bind variables for that statement are displayed here.
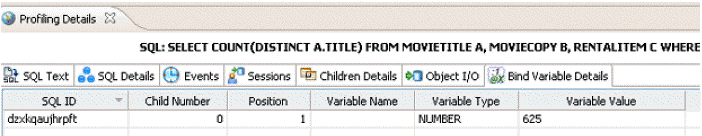
The following parameters are displayed on the Bind Variable Details tab:
| Value | Description |
|---|---|
| SQL ID | SQL identifier used by the data source. |
| Child Number | A new child number is generated for the SQL ID of the query whenever the plan changes, for example the value of a bind variable is changed, and the query is executed again. |
| Position | The position of the variable within the SQL text. For example, given the query, select * from T1 where C1 = :a and C2 = :b and C3 = :c and C4 = :d, the position of a is 1, b is 2, c is 3 and d is 4. |
| Variable Name | The name of the variable. |
| Variable Type | The data type of the variable. |
| Variable Value | The value of the variable. |
Viewing details on the Blockers tab (Oracle)
In the Top Activities Section, selecting an entry on the Blocked Sessions tab displays information on sessions holding blocking locks in the Profiling Details view.
Blocked Sessions
The Blocked Sessions tab provides general information on blocked sessions and the details identifying the specific row locked.
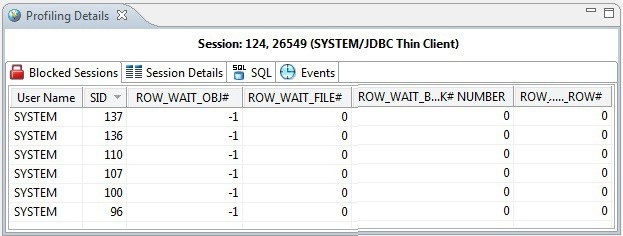
This tab provides the following columns for each blocked session:
Value | Notes |
|---|---|
User Name | The user name under which the blocking session was run. |
SID | The SID value of the blocking session. |
ROW_WAIT_OBJ# | Object ID of the table containing the row specified in ROW_WAIT_ROW#. |
ROW_WAIT_FILE# | Identifier of the datafile containing the row specified in ROW_WAIT_ROW#. |
ROW_WAIT_BLOCK# | Identifier of the block containing the row specified in ROW_WAIT_ROW#. |
ROW_WAIT_ROW# | The current row being locked. |
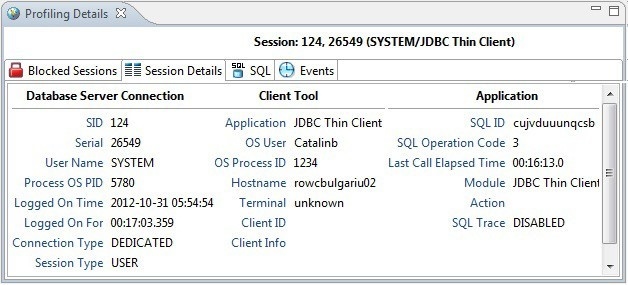
Session Details
The Session Details tab provides information on the server connection, client, and application associated with the blocking session.
SQL
The SQL tab displays information about the statements associated with the blocking session.
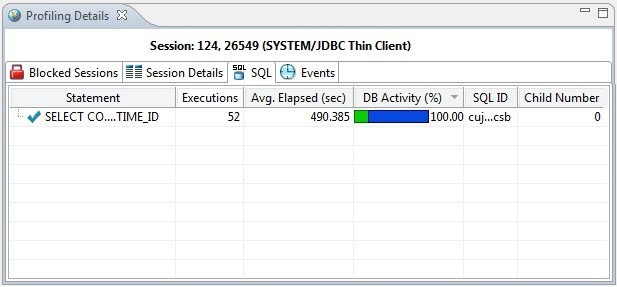
SQL statements are listed by the following parameters:
| Value | Notes |
|---|---|
| Statement | The name of the statement. |
| Executions | The number of times the statement was executed during the session. |
| Activity (%) | A graphical representation of the distribution of execution and wait time for the statement or statement component. |
| SQL ID | The SQL ID value of the statement. |
| Child Number | The child number in the database. |
Events
The Events tab provides details about the events that the blocking session is associated with.
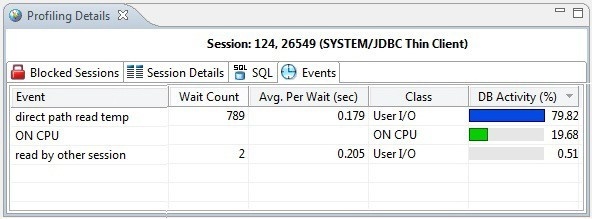
Events are listed by the following values:
| Value | Notes |
|---|---|
| Event | The name of the event. |
| DB Activity (%) | A graphical representation of the distribution of execution and wait time for the statement or statement component. |
Viewing details on the Events tab
In the Top Activities Section, selecting a statement entry on the Event tab displays information in the Profiling Details view. The graph portion and details on the event category tabs on the new editor pertain only to the selected statement. Additionally, new tabs become available.
Selecting an event type entry on an event category tab opens a new profiling editor page. The graph portion and details on the Events tab and event category tabs on the new editor page pertain only to the selected wait event and to SQL statements that waited in that event.
- SQL tab: Shows the statements involved in the selected event. For more information, see SQL.
- Sessions tab: Displays information about the sessions that the selected event is associated with. For more information, see Sessions.
- Procedures tab: Displays information about the procedures that ran during the selected event. For more information, see Procedures.
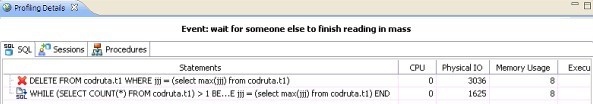
SQL
The SQL tab displays information about the SQL statements involved in the selected event.
| Value | Notes |
|---|---|
| Statement | The name of the statement. |
| SQL ID | The ID value of the SQL statement. |
| Child Number | The child number in the database. |
| Parsing User ID | The ID of the user who parsed the statement. |
| Plan Hash Value | The execution value of the statement. |
| CPU | Cumulative CPU time for the process. (measured in "ticks", an arbitrary unit of time) |
| Physical IO | Cumulative disk reads and writes for the process. (total count) |
| Memory Usage | Number of pages in the procedure cache that are currently allocated to this process. A negative number indicates that the process is freeing memory allocated by another process. |
| Executions | The number of times the statement was executed. |
| Activity (%) | A graphical representation of the distribution of execution and wait time for the statement or statement component. |
Sessions
The Sessions tab displays the sessions and related information regarding those that were associated with the selected event.
The following parameters are displayed on the Sessions tab:
| Value | Notes |
|---|---|
| User Name | The user name under which the session was run. |
| Program | The name of the executable under which the session was run. |
| SID | The SID value of the session. |
| Serial Number | The serial number of the machine from which the session executed. |
| Activity (%) | A graphical representation of the distribution of execution and wait time for the statement or statement component. |
| Machine | The machine name and network location of the machine from which the session executed. |
| Session Type | The type of session. |
Procedures
The Procedures tab displays the procedures and related information regarding those that were associated with the selected event.
The following parameters are displayed on the Procedures tab:
| Value | Notes |
|---|---|
| Procedure Name | The name of the procedure that ran during the event. |
| Database Name | The name of the database where the procedure resides. |
| Procedure ID | The unique ID of the procedure. |
| Executions | The number of times the procedure ran during the event. |
| DB Activity (%) | A graphical representation of the distribution of execution and wait time for the procedure. |
Viewing details on the Procedures tab
In the Top Activities Section, selecting a procedure entry on the Procedure tab displays information in the Profiling Details view. The graph portion and details on the procedure category tabs on the new editor pertain only to the selected procedure. Additionally, new tabs become available.
Selecting a procedure type entry on a procedure category tab opens a new profiling editor page. The graph portion and details on the Procedure tab and procedure category tabs on the new editor page pertain only to the selected procedure and to SQL statements that waited in that procedure.
- The SQL Text tab shows the SQL of the procedure. For more information, see SQL Text.
- The SQL shows the statements involved in the procedure. For more information, see SQL.
- The Events displays the time and parameter information about the selected procedure. For more information, see Events.
- The Sessions displays information about the sessions that the selected procedure is associated with. For more information, see Sessions.
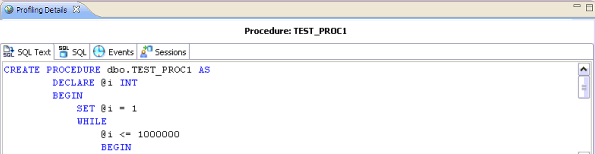
SQL Text
The SQL Text tab displays the full code of the procedure.
SQL
The SQL tab displays information about the SQL statements involved in the selected procedure.

The SQL tab displays the following parameters about the statement:
| Value | Notes |
|---|---|
| Statement | The name of the statement. |
| SQL ID | The ID value of the SQL statement. |
| Child Number | The child number in the database. |
| Parsing User ID | The ID of the user who parsed the statement. |
| Plan Hash Value | The execution value of the statement. |
| CPU | Cumulative CPU time for the process. (measured in "ticks", an arbitrary unit of time) |
| Physical IO | Cumulative disk reads and writes for the process. (total count) |
| Memory Usage | Number of pages in the procedure cache that are currently allocated to this process. A negative number indicates that the process is freeing memory allocated by another process. |
| Executions | The number of times the statement was executed. |
| Activity (%) | A graphical representation of the distribution of execution and wait time for the statement or statement component. |
Events
The Events tab provides details about the events that the session is associated with.
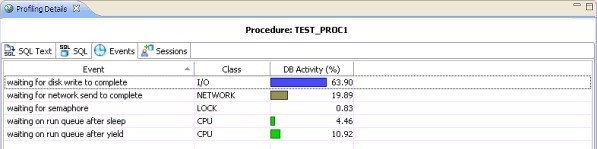
Events are listed by the following values:
| Value | Notes |
|---|---|
| Event Name | The name of the event. |
| Class | The wait group the event in the selected procedure belongs to. |
| Activity (%) | A graphical representation of the distribution of execution and wait time for the event. |
Sessions
The Sessions tab displays the sessions and related information regarding those that were associated with the selected procedure.
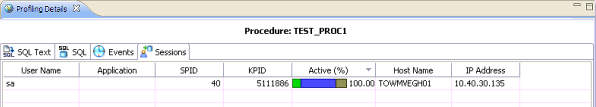
The following parameters are displayed on the Sessions tab:
| Value | Notes |
|---|---|
| User Name | The user name under which the session was run. |
| Program | The name of the executable under which the session was run. |
| SID | The SID value of the session. |
| Serial Number | The serial number of the machine from which the session executed. |
| Activity (%) | A graphical representation of the distribution of execution and wait time for the statement or statement component. |
| Machine | The machine name and network location of the machine from which the session executed. |
| Session Type | The type of session. |