This section includes the following topics:
- About configuring Precise for J2EE
- About configuring registry settings
- About configuring Precise for J2EE features
- About configuring EJB 3.0 monitoring
- About configuring JMS monitoring
- About configuring findings settings
- About configuring HTTP query parameters and Java method arguments capturing
- About file system security
- About monitoring settings for a J2EE remote instance
About configuring Precise for J2EE
Precise for J2EE v9.0 introduces the Monitor Settings dialog box to the user interface. This dialog box is recommended for configuring most of the common Precise for J2EE instrumentation. For details, see About configuring Precise for J2EE settings in the Precise for J2EE User Guide. In some cases, however, it may be preferable to manually perform specific instrumentation. This section describes these cases.
In Precise for J2EE v9.0, the installation and configuration directories for all instances (for all installation types) are centrally located in the registry, installed on a central JVM defined as the host, with the following path: products\i3fp\registry\. Whenever the JVMs are restarted, they are configured according to the information found in the XML files located in the registry folder. As a result, any change made to a file in the registry will take affect after a JVM restart.
In addition to the registry configuration files, local directories still exist on each JVM. The file system path of the local Precise installation directory is <i3_root>. <i3_root> may also be called the Precise root directory, such as PreciseSoftware.
The Precise for J2EE products directory path is \<i3_root>\products\j2ee.
The JVM identifier that was chosen or given (depending on the installation type) during installation is referred to as JVMID. The JVMID directory is used to store JVM-specific settings. It is referred to within the file system paths, such as \i3\products\j2ee\config\JVMID. For example, if you choose PetStore as a JVMID, the JVMID directory would be \i3\products\j2ee\config\PetStore.
Any changes made on a local directory will immediately take effect, but only until the next JVM restart, when the JVM will reload the configuration found in the registry and override the local changes.
About configuring registry settings
This section describes the registry settings configuration process.
Registry structure and inheritance
Some configurations are relevant per instance (e.g. collect-post-parameters) and some are relevant for the J2EE collector in general (e.g. preferred-data-port). Others are relevant for the whole product (e.g. user-agents). Instance configuration resides in the instance registry file:
products\i3fp\registry\instances\j2ee\<server-name>\<instance_name>\<settings>.xml
You can set instance configuration in the products\i3fp\registry\instances\j2ee\<server-name>\<settings>.xml file if you want to set the same setting for all instances on the machine. Consider however, that settings in the instance registry will override the settings in the server registry.
J2EE collector configuration resides in the registry file:
products\i3fp\registry\instances\j2ee\<server-name>\<settings>.xml
You can set the configuration for all J2EE collectors at once by modifying the file products\i3fp\registry\products\j2ee\focal-point.xml
Consider however, that settings in the server registry will override the settings in the focal-point.xml file.
Product level configuration resides in the registry file: products\i3fp\registry\products\j2ee\focal-point.xml
J2EE collector behavior is set via the registry entry <j2ee-collector>
Cluster configuration resides in the registry file:
products\i3fp\registry\clusters\j2ee\<cluster-name>\<settings>.xml
Instance registry
Configuring the instance registry only affects the specific instance. Every element in the instance registry can also be specified in the server registry file, in which case it affects all the instances on that server.
To change the instance registry
- On the relevant Precise node (proxy), manually change the products\i3fp\registry\instances\j2ee\<server-name>\<instance_name>\<settings>.xml file.
- Save the file.
- Run the
update-main-registryCLI command on the same Precise node.- UNIX. ./infra/bin/psin_cli.sh -action update-main-registry -i3-user admin -i3-clear-password admin -registry-path /registry/clusters/j2ee/<server-name>/<instance-name>
- Windows. infra\bin\psin_cli.bat -action update-main-registry -i3-user admin -i3-clear-password admin -registry-path /registry/clusters/j2ee/<server name>/<instance name>
This will force a registry sync from the node's FocalPoint to the main FocalPoint.
Cluster registry
Configuring the cluster registry affects all instances of the specific cluster.
All instances in the cluster need to be restarted via AdminPoint after changing the cluster registry.
To change the cluster registry:
- On the relevant Precise node (proxy), manually change the products\i3fp\registry\clusters\j2ee\<cluster-name>\<settings>.xml file.
- Save the file.
- Run the
update-main-registryCLI command on the same Precise node.- UNIX. ./infra/bin/psin_cli.sh -action update-main-registry -i3-user admin -i3-clear-password admin -registry-path /registry/clusters/j2ee/<cluster-name>
- Windows. infra\bin\psin_cli.bat -action update-main-registry -i3-user admin -i3-clear-password admin -registry-path /registry/clusters/j2ee/<cluster_name>
This will force a registry sync from the node's FocalPoint to the main FocalPoint.
Cluster registry changes override the FocalPoint registry changes.
About configuring Precise for J2EE features
This section includes configuration details for exception seeking and data filtering.
About configuring exception seeker options
Precise for J2EE catches exceptions during a time slice, based on its instrumentation configuration and filtering criteria. Filtering can be performed at the JVM level (that is: instrumentation and collector.xml level) and the GUI level to configure portlets.
Exceptions filtered at the JVM level will not be sent to the Precise for J2EE FocalPoint. View the exceptions on the Precise for J2EE Dashboard tab.
Configuring instrumentation parameters (JVM)
Perform the following steps to configure instrumentation parameters.
To configure instrumentation parameters (JVM)
- In any Precise for J2EE tab, go to Settings>Monitor Settings.
- In the Monitor Settings dialog box, mark the “Monitor Exceptions” check box.
Restart the JVM.
The changes take place at the instrumentation level. Therefore, the changes will only occur after restarting the JVM.
If you have a large amount of exceptions, focus on a specific exception by defining a filter on an exception class name (JVM).
To define a filter on an exception class name
- Open the collector.xml file in the registry folder. Use this file to define a filter on an exception class name, using regular expressions.
- Edit the following tag:
<exceptionFilterByName></exceptionFilterByName>
The default filter tag is:<exceptionFilterByName>.*</exceptionFilterByName> - Run the relevant CLI command as it appears in step 3 of Instance registry or Cluster registry.
About configuring data filtering
To reduce the quantity of collected data and propagate mainly meaningful data, a filtering mechanism is used. This mechanism is used to filter nodes and invocations before loading the data into the PMDB.
About the data filtering stages
The Precise for J2EE data filtering mechanism contains the following three stages:
- Top N branches filtering. Sorts each invocation tree by service time, only keeping the top n entry points (with their underlying call tree), as defined in the filtering configuration.
Filtering by service time. For each entry point, all underlying branches (including locked methods) with a service time lower than the defined percent of the entry point’s service time are filtered.
No information regarding the filtered branch’s SQLs or exit points will be displayed.
Filtering by work time. Filters branches (only branches, and keeps their underlying call tree) with a work time lower than the defined threshold.
Locked methods are always displayed.
It is highly recommended not to alter the default data filtering values. Changes to the default values should only be made in extreme cases that either require maximum data, such as POC environments, or in cases of data overflow where stricter data filtering must be applied.
Configuring data filtering
To configure data filtering:
- Open the collector.xml file in the registry folder.
- Add the following element:
<agent-config>
<vendor>undefined (version undefined)</vendor>
<memloginterval>100</memloginterval>
<agginterval>30</agginterval>
<topnsql>5</topnsql>
<minSQLThreshold>100</minSQLThreshold>
<loggerEnabled>true</loggerEnabled>
<dirconnenabled>false</dirconnenabled>
<dirconnport>20764</dirconnport>
<exceptionFilterByName>.*</exceptionFilterByName>
<filteringEnabled>true</filteringEnabled>
<filteringMaxInvocationTrees>100</filteringMaxInvocationTrees>
<filteringPercent>1</filteringPercent>
<filteringThreshold>5</filteringThreshold>
<useStartupClass>false</useStartupClass>
</agent-config> - Run the relevant CLI command as it appears in step 3 of Instance registry or Cluster registry.
The following table lists the available parameters:
Table 8-1 Data filtering configuration parameters
| Parameter | Description |
|---|---|
| filteringEnabled | Activates and deactivates data filtering. Type: Boolean Default value: true |
filteringMaxInvocationTrees | The maximum number of entry points to keep, based on service time. Type: Integer Default value: 100 For more information, see About the data filtering stages. |
filteringPercent | The minimum percent value of the entry point’s service time necessary to keep a node. Type: Integer Default value: 1 For more information, see About the data filtering stages. |
filteringThreshold | The minimum work time value (milliseconds) threshold to keep a node. Type: Integer Default value: 5 For more information, see About the data filtering stages. |
Keeping exceptions of filtered invocations
After selecting the data filtering method, the user can choose to mark the option: “Keep exceptions for filtered methods”. The exceptions will be included in the total per JVM, even though their source is not displayed.
About configuring EJB 3.0 monitoring
Precise for J2EE provides default monitoring for EJB 3.0 annotations. Metadata annotations are a key element in the developmental simplification of EJB 3.0 applications. Metadata annotations are used by the developer to specify expected requirements on container behavior, to request the injection of services and resources, and to specify object/relational mappings. Metadata annotations may be used as an alternative to the deployment descriptors that were required by earlier versions of the EJB specification.
While the EJB 3.0 specification allows (and promotes) defining EJBs using annotations, it is also still possible to use an XML deployment descriptor (the previous EJB 2.0 method). Because this is not automatically monitored by Precise, the following procedure must be run for the appropriate application server, as follows:
WebLogic
To monitor EJB3.0 in a WebLogic environment using a XML deployment descriptor file only (no annotations)
- Add the following entry to the <i3_root>/products/i3fp/registry/clusters/j2ee/<cluster-name>/InstrumenterConfigLis t.xml file:
<config-file>
WeblogicEjb3Config-FD.xml
</config-file> - Run the relevant CLI command as it appears in step 3 of Instance registry or Cluster registry.
WAS
To monitor EJB3.0 in a WAS environment using a XML deployment descriptor file only (no annotations)
- Add the following entry to the <i3_root>/products/i3fp/registry/clusters/j2ee/<cluster-name>/InstrumenterConfigLis t.xml file:
<config-file>
WebSphereEjb3Config-FD.xml
</config-file> - Run the relevant CLI command as it appears in step 3 of Instance registry or Cluster registry.
Jboss
To monitor EJB3.0 in a Joss environment using a XML deployment descriptor file only (no annotations)
- Add the following entry to the <i3_root>/products/i3fp/registry/clusters/j2ee/<cluster-name>/InstrumenterConfigLis t.xml file:
<config-file>
JbossEjb3Config-FD.xml
</config-file> - Run the relevant CLI command as it appears in step 3 of Instance registry or Cluster registry.
About configuring JMS monitoring
By default, Precise for J2EE instrumentation of JMS calls is disabled, and must be manually configured to enable monitoring for transactions that use synchronous JMS. Since JMS is an asynchronous API, to configure this functionality the thread that initiates the JMS calls on the client-side must contain a method which calls both the JMS send and receive operations, and represents the bounds of the "synchronous JMS call".
For example, the following method could be configured as a JMS exit point:
public String sendSyncMessage (Message msg) {
// Do some things... MessageProducer.send(msg);
// Do some things...
Message reply = MessageConsumer.receive();
return reply.getText();
- In the
<i3_root>\products\j2ee\configfolder of the instances that sample JMS client and server calls, add the following element to thej2ee\config\[instance_id]\instrumenterconfiglist.xmlfile:
<config-file>
JMS_Calls_AOP.xml
</config-file> - In the j2ee instrumenter config folder, apply the following change to the
j2ee\config\instrumenter\JMS_Calls_AOP.xmlfile:
aspect.wrapper.target.class: jms.wrapper
aspect.wrapper.target.method:
sendSyncMessage
aspect.wrapper.target.signature: * - Stop and restart the monitored JVMs.
About configuring findings settings
The Precise for J2EE Dashboard and Activity tabs include the findings area. This area displays specific problematic issues detected in the J2EE activity monitored by Precise for J2EE. The findings are displayed according to the definitions configured in the findings-config.xml file located in the registry file.
To modify the findings parameter settings
- Open the
findings-config.xmlfile from the following path on the FocalPoint server:<i3_root>\products\i3fp\registry\products\j2ee\findings-config.xml - Modify the desired configurable parameters. For more information regarding these parameters, see Table 8-2 Configurable parameters in the findings-config.xml file.
- Run the relevant CLI command as it appears in step 3 of Instance registry or Cluster registry.
- Restart the Precise for J2EE FocalPoint.
The following table describes the configurable findings parameters.
Configuring a parameter not mentioned in the Configurable parameters in the findings-config.xml file table may lead to errors in the displayed findings, or a general failure to load the findings. To configure such parameters, contact Precise Customer Support.
Table 8-2 Configurable parameters in the findings-config.xml file
| Parameter | Description |
|---|---|
| max-findings-to-display | The maximum number of findings to be displayed in the user interface. Type: Integer Default value: 7 |
| timeout-in-seconds | The time limit (in seconds) that the findings query will run. Type: Integer Default value: 20 |
enabled | The finding will only be displayed if it is enabled. Type: Boolean Default value: true |
| tab | The finding will only be displayed in the specific tab (activity or dashboard) if it is enabled. Type: Boolean Default value: true |
| topN-to-display | The maximum number of times a specific type of findings will be displayed (with different contexts). Type: Integer Default value: 2 |
thresholds | Each finding’s severity is calculated based on finding specific thresholds. Type: Integer |
About configuring HTTP query parameters and Java method arguments capturing
Under certain circumstances, you may want to capture the HTTP servlet request query arguments and select Java method arguments. This section describes the configuration steps required to enable these features in Precise for J2EE.
A portal typically uses HTTP servlet request query string parameters to identify user services. Usually, very few servlets perform many different functions. The functions are differentiated by various query string parameter name=value pairs that are submitted in the URL. Additionally, URI paths may be independent of the query string parameters. Capturing the HTTP servlet request query string parameters to identify portal services is described in this section. In the following hyperlink, the substring s=VRTS is an HTTP query string parameter:
http://finance.yahoo.com/q?s=VRTS
Application services, such as BEA’s Tuxedo, provide a Java API to select the desired service. Application programmers usually select the desired service by passing to the API an object, or string selector, describing their desired service. Capturing the Java parameters that are used to identify Tuxedo services is described in this section.
About getting started
You must first install Precise for J2EE and be able to collect and view application data in the Precise for J2EE user interface.
About capturing HTTP servlet query parameters
The configuration and interpretation of capturing HTTP query parameters is described in the following sections:
About configuring parameter capture
To enable HTTP Servlet Query parameter capture, add the following system property to your application server’s Java command line:
-Dindepth.j2ee.http.request.query.parameters=[options]
The value of the property (its [options]) controls which parameters are captured. A comma-separated list of parameter names is used to identify one or more specific parameters. A single asterisk is used to represent all parameters.
In Precise for J2EE, the captured parameter names and values are appended to the URL of HTTP type invocations. A colon separates the method name from the parameter list. Each parameter is separated from its value by an equal (=) symbol. Commas separate parameter name/value pairs. Commas replace Ampersands. A maximum combined method name and parameter length of 128 characters is captured and displayed. See About using parameter capture.
In addition, to print the entire HTTP query string and URI in the application server’s console window, add the following system property to your application server’s Java command line. This feature is useful for learning about the applications usage of specific query arguments:
-Dindepth.j2ee.verbose.parameters=true
In this example Java command line, we enable HTTP Servlet Query parameter capture for action and itemld parameters that are used in the Java PetStore application running on WebLogic 9 by adding the following:
...-Dindepth.j2ee.verbose.parameters=true
-Dindepth.j2ee.http.request.query.parameters=action,itemid
...
In a PeopleSoft v8 demo example, we found this property value sufficient to capture interesting parameters that differentiated executions of each screen:
-Dindepth.j2ee.http.request.parameters=FolderRef,Page,PortalActualURL,cmd
About using parameter capture
Typically, we start by using the following configuration:
-Dindepth.j2ee.http.request.parameters=* and-Dindepth.j2ee.verbose.parameters=true
When we use this configuration all parameters on the console are printed, enabling us to inspect and learn which parameters are significant as we navigate through the application.
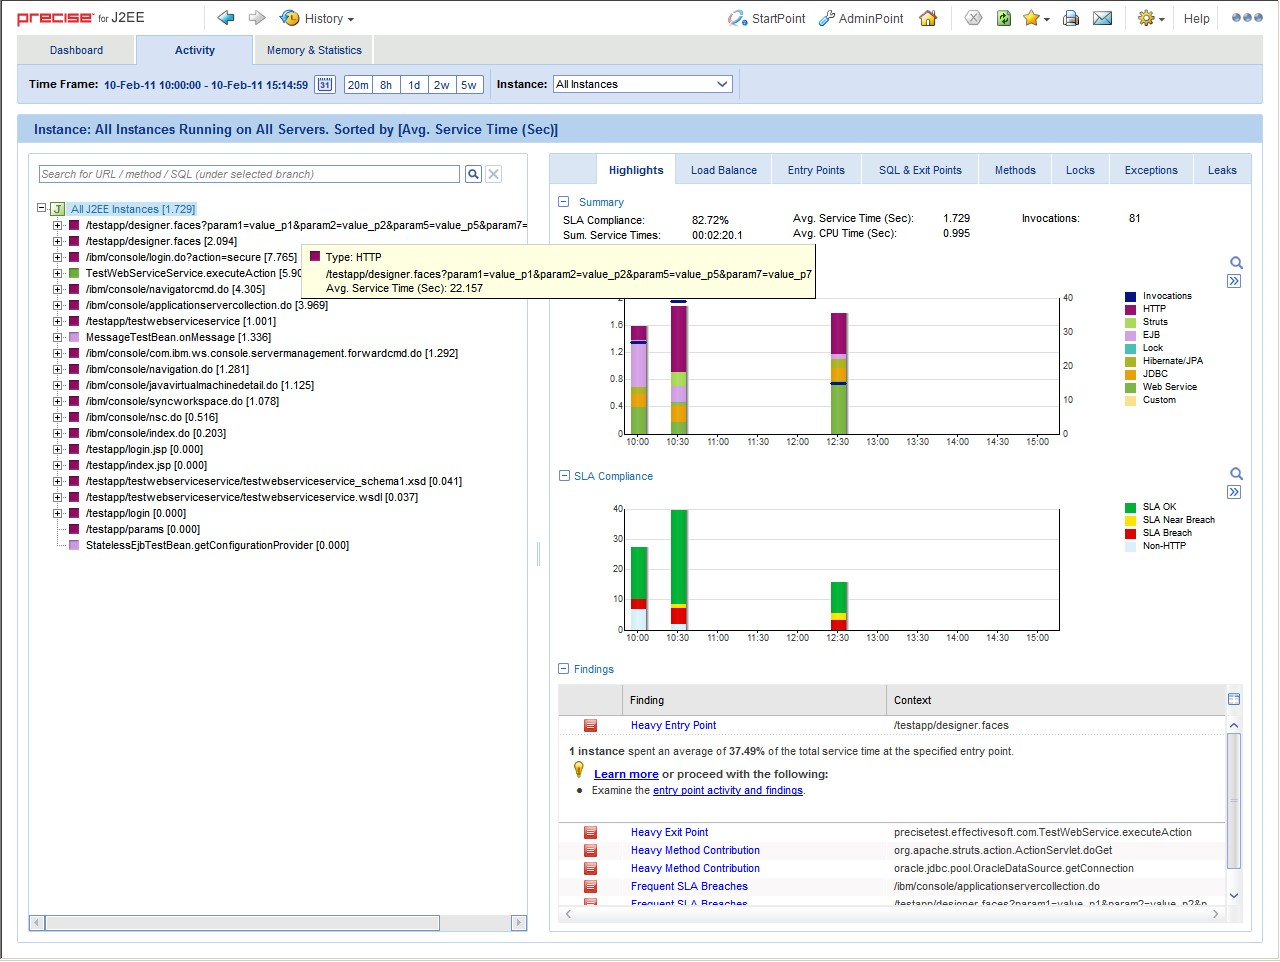
After we learn which parameters are important to us, we focus the capture on a few parameters by specifying them individually in a list, for example -Dindepth.j2ee.http.request.query.parameters=param1,param2,param5,param7
Capturing all parameters can use significant system resources. As a result, capturing all parameters all the time is not recommended in production environments.
Figure 8-1 HTTP SRs using -Dindepth.j2ee.http.request.query.parameters=param1,param2,param5,param7
About capturing Java method arguments
The following example illustrates the configuration and interpretation of captured Java method arguments. This example describes the instrumentation of Tuxedo service names from BEA's Jolt API as declared in the Jolt.xml instrumentation configuration file included in Precise for J2EE. To enable the Tuxedo service name capture, add the following element to your <i3_root>/products/i3fp/registry/clusters/j2ee/<cluster-name>/InstrumenterConfigList.x ml file:
<!--
BEA Jolt custom instrumentation
-->
<config-file>
Jolt.xml
</config-file>
To enable Java method argument capture, add a custom instrumentation element to an enabled instrumentation configuration file. The following example shows one of these elements that are configured for bea.jolt.JoltRemoteService. The example is taken from the Jolt.xml instrumentation configuration file that is distributed with Precise for J2EE. In this example, we display the Tuxedo service name whenever the bea.jolt.JoltRemoteService.call method is executed. A complication is that the Tuxedo service name is specified in the bea.jolt.JoltRemoteServiceconstructor (init) method and not passed directly to each execution of call.
Following is an example for the Java Method argument capture, custom instrumentation element, for bea.jolt.JoltRemoteService:
<instrumenter-config>
<custom-config>
<java-classes>
<java-class>
<class-name>
bea.jolt.JoltRemoteService
</class-name>
<methods>
<capture-method>
<name>
init
</name>
<capture-param-index>
0
</capture-param-index>
</capture-method>
<method>
<name>call</name>
</method>
</methods>
</java-class>
</java-classes>
</custom-config>
</instrumenter-config>
The <capture-method> element that is shown in this example identifies the Java method to be used to capture the data. The captured data is displayed in Precise for J2EE for methods specified by the <method> elements that share the same <java-class> element as the <capture-method> element. For the bea.jolt.JoltRemoteService.call case, since the Tuxedo service name is actually specified in the constructor (init) method, init is specified as the <capture-method> element.
The <capture-param-index> element defines the index count of the Java method argument to capture. The first argument is numbered zero, the second argument is numbered 1, and so on. The captured argument is converted to a string, using toString(), and appended (separated by a colon) to the method name of interest.
If you use the <capture-param-index> element without the <capture-method> element, the argument value of the index number that the <capture-param-index> element specifies is displayed following the associated method name. In other words, when <capture-method> is not used and <capture-param-index> is used, the argument that is specified by the <capture-param-index> element is both captured and appended to the method that is entered in the <name> element. For example, the following configuration appends the doProcess method’s first argument value to the doProcess method name that is displayed in Precise for J2EE.
<methods>
<method>
<name>doProcess</name>
<capture-param-index>0</capture-param-index>
</method>
</methods>
About file system security
Precise for J2EE requires two types of system users: the Precise user and the user who starts the application server that Precise for J2EE monitors. These users are created when you install Precise for J2EE. While the Precise user must have read, write, and execute permissions for all subdirectories in the <i3_root> and the <i3_root>/products/j2ee directories, you can restrict the permissions for some subdirectories for the application server user or group.
If the Precise user and the application server user are the same, give the application server user the same permissions as the Precise user.
The following table shows the minimum permissions that you can set for the application server user or group for the <i3_root> dir
Table 8-3 Minimum permissions for the <i3_root> directory for the application server user
| Directory | Minimum permissions |
|---|---|
<i3_root>/distribution | read, execute |
<i3_root>/infra | read, execute |
<i3_root>/java | read, execute |
<i3_root>/products | read, execute |
<i3_root>/support | read, write, execute |
<i3_root>/logs | read, write, execute |
The following table shows the minimum permissions that you can set for the application server user or group for the <i3_root>/products/j2ee directory.
Table 8-4 Minimum permissions for the <i3_root>/products/j2ee directory for the application server user
| Directory | Minimum permissions |
|---|---|
<i3_root>/products/j2ee | read, execute |
<i3_root>/products/j2ee/archive | read, execute |
<i3_root>/products/j2ee/cache | read, execute |
<i3_root>/products/j2ee/config | read, write, execute |
<i3_root>/products/j2ee/install | read, execute |
<i3_root>/products/j2ee/lib | read, execute |
<i3_root>/products/j2ee/samples | read, execute |
<i3_root>/products/j2ee/support | read, execute |
<i3_root>/products/j2ee/bin | read, execute |
<i3_root>/products/j2ee/classes | read, execute |
<i3_root>/products/j2ee/etc | read, write, execute |
<i3_root>/products/j2ee/installed | read, execute |
<i3_root>/products/j2ee/logs | read, write, execute |
<i3_root>/products/j2ee/smartlink | read, write, execute |
<i3_root>/products/j2ee/tac | read, write, execute |
About monitoring settings for a J2EE remote instance
This section describes the following monitoring settings:
- Time slice size
- Using Web patterns
- Enabling/Disabling JMX data collection
- Enabling/Disabling Exception Seeker
- Enabling/Disabling Leak Seeker
For information about installing a remote J2EE instance, see the Installing the J2EE remote instance in the Precise CLI Utilities Reference Guide.
Time slice size
Currently 2 time slice sizes are supported: 30 seconds, 5 minutes. To change the slice size setting for a monitored JVM
- Open the <LOCAL-LIB>/products/j2ee/config/<JVM-NAME>/collector.xml file for editing.
- Edit the value of the <agginterval> node and specify one of the following supported values in seconds: 30 or 300.
For example: <agginterval>30</agginterval>
- Save the file.
- Restart the JVM for the changes to take effect.
Using Web patterns
Perform the following steps to apply URL patterns defined for the Web instance. To define a pattern
- Make sure Precise for Web is installed on the server of the remotely monitored JVM.
- Copy the
TacPaterns.xmlfile fromproducts/j2ee/config/on the Precise FocalPoint server toproducts/j2ee/config/folder inside the extracted ZIP folder on the JVM side. If the file does not exist, restart the Precise FocalPoint. - Restart the JVM to start using the patterns defined by the
TacPaterns.xmlfile.
Enabling/Disabling JMX data collection
To enable/disable JMX data collection, choose the corresponding the Application Server vendor below and perform the procedure described for the vendor.
Tomcat <VERSION>
Enable the Application Server Metrics
To enable Precise for J2EE to collect Application Server Metrics, a startup class must be loaded and executed on the server being monitored.
To configure the startup class
- Copy the <PRECISE_HOME>/products/j2ee/lib/indepthmetric.jar file into the
<TOMCAT_HOME>/libfolder. - Add the following xml entry to the
<TOMCAT_HOME>/conf/server.xmlfile just below the other
<Listener> entries: <Listener className="com.precise.javaperf.extensions.tomcat.JMXMetricsLoaderListener"/>
Choose a default list of metrics
Copy the <PRECISE_HOME>/products/j2ee/etc/metrics/TOMCAT/<VERSION>/measurements.xml file to the <PRECISE_HOME>/products/j2ee/config/<JVM_ID> folder.
WebLogic <VERSION>
Choose a default list of metrics
Copy the <PRECISE_HOME>/products/j2ee/etc/metrics/WEBLOGIC/<VERSION>/measurements.xml file to the <PRECISE_HOME>/products/j2ee/config/<JVM_ID> folder.
WebSphere <VERSION>
Choose default list of metrics.
Copy the <PRECISE_HOME>/products/j2ee/etc/metrics/WEBSPHERE/<VERSION>/measurements.xml file to the <PRECISE_HOME>/products/j2ee/config/<JVM_ID> folder.
Jboss <VERSION>
Enable the Application Server Metrics
To enable Precise for J2EE to collect Application Server Metrics, a startup class must be loaded and executed on the server being monitored.
To configure the start up class
- Copy the <PRECISE_HOME>/products/j2ee/etc/metrics/JBOSS/<VERSION>/Precise for J2EE-startupclass.sar file into the <JBOSS_HOME>/server/<YOUR_SERVER>/deploy folder.
- Choose a default list of metrics
Copy the <PRECISE_HOME>/products/j2ee/etc/metrics/JBOSS/<VERSION>/measurements.xml file to the <PRECISE_HOME>/products/j2ee/config/<JVM_ID> folder.
Enabling/Disabling Exception Seeker
To enable the Exception Seeker feature
- Open the <LOCAL-LIB>/products/j2ee/config/<JVM-NAME>/InstrumenterConfigList.xml file for editing.
- Add the following XML node under the root node:
<config-file>
ExceptionSeeker.xml</config-file> - Restart the JVM.
To disable the Exception Seeker feature
- Delete this node inside the
InstrumenterConfigList.xml. - Restart the JVM.
Enabling/Disabling Leak Seeker
To enable the Leak Seeker feature
- Open the <LOCAL-LIB>/products/j2ee/config/<JVM-NAME>/InstrumenterConfigList.xml file for editing.
- Add the following XML node under the root node:
<config-file>
LeakSeeker.xml</config-file> - Restart the JVM.
To disable the Leak Seeker feature
- Delete this node inside the
InstrumenterConfigList.xmlfile. - Restart the JVM.