This section includes the following topics:
- About the Dashboard tab
- How the Dashboard tab is structured
- How the Dashboard can help you identify performance problems
About the Dashboard tab
The Dashboard tab (displayed in provides an overview of the information displayed in the other Precise for DB2 tabs. It lets you quickly identify the most active database partitions which are most likely to benefit from a tuning operation.
The Dashboard tab lets you identify the top resource consumers of your DB2 database partitions within the selected time frame. This will guide you in your search for the root cause of a problem. You can also select a database partition and watch its activity over the last hours, days, or months.
The Dashboard tab provides answers to questions like: "Are all my DB2 database partitions up and running?"; "Which database partition is consuming the most resources?"; "Which application is consuming the most resources for the specified database partition and across all database partitions?", "Is the problem related to a slow I/O, a low hit-ratio, a memory shortage, high CPU consumption, or another specific problem?"
The All row in the All DB2 Databases table located in the Main area (left pane) displays the average availability of all database partitions. When you select the All row, a summary of the activities of all the database partitions and a comparison of application identifiers is displayed in the tab views in the Database Details area (right pane).
If you are working with SAP and ERP support is installed, the Dashboard tab displays information on DB2 activity in relation to the ERP application and users, and specific information on executed views and transactions.
When an extension for ERP is installed, the Precise for DB2 Collector divides DB2 activities into several groups, called work types.
| Technology | Work type |
|---|---|
| SAP Dialog | Activities generated from the SAP Dialog work process. |
| SAP Update | Activities generated from the SAP Update work process. |
| SAP Spool | Activities generated from the SAP Spool work process. |
| SAP Background | Activities generated from the SAP Background work process. |
All databases, including those with only one partition, are referred to as database partitions. In the Multipartition column, databases with only one partition will have a value = No.
How the Dashboard tab is structured
Figure 1 Precise for DB2 Dashboard tab
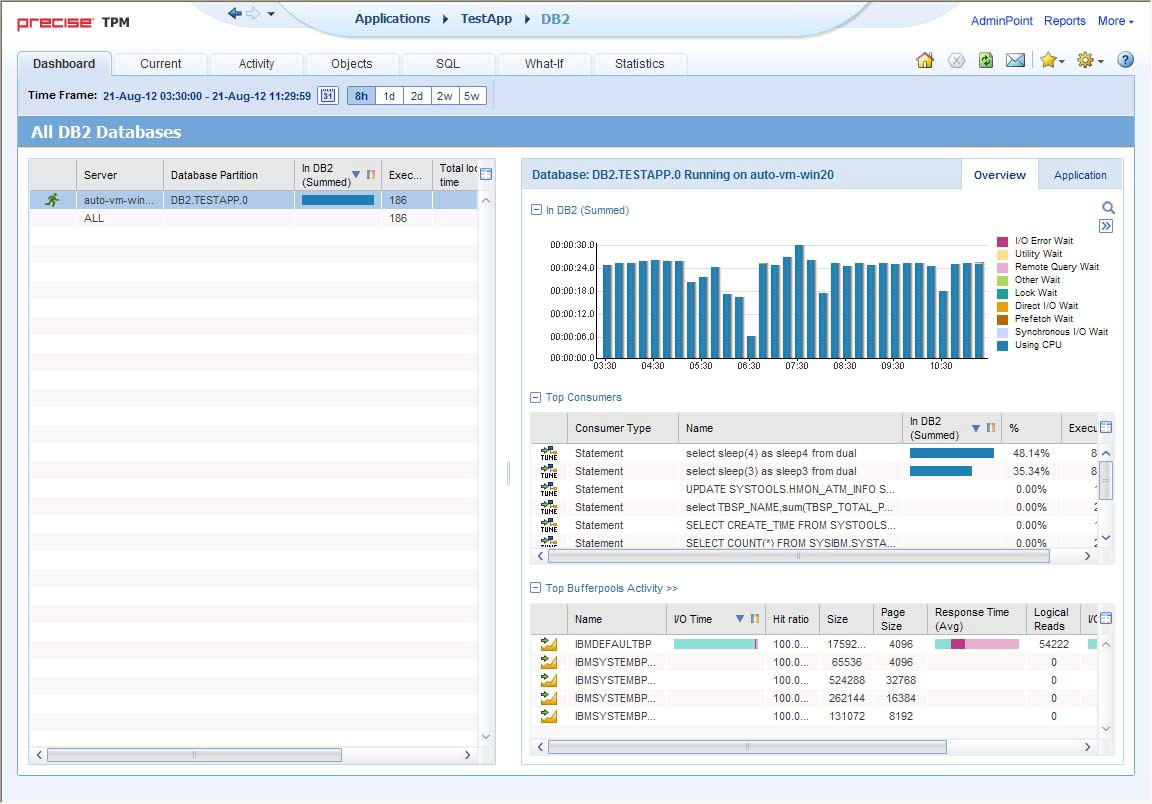
The Dashboard tab is divided into two areas—the Main area and the Details area. The Main area lists all the databases or database partitions that are monitored by Precise for DB2. The Details area provides comparative information regarding the selected database partition.
You can filter the information shown in the Details area so that only the contribution of certain entities is included. See Filtering data.
About the general tab structure
The following table displays information on the general structure of the Dashboard tab.
Table 1 Elements of the Dashboard tab
| Element | Description |
|---|---|
| Time Frame | Allows selecting the time frame we want to work with. The time frame influences all counters displayed (e.g., executions, I/O time). |
| Filter On/Off | Allows filtering the displayed information according to user-defined conditions. |
| Tab heading | Displays All DB2 databases. |
| Main area | Each row displays a single database or a single database partition. It displays all databases/partitions which belong to the current tab. Also displayed is a summary row (All). |
| Details area heading | Displays either a database partition and the name of the server it is running on, or all databases running on all servers. <number> is displayed only if the partition belongs to a multi-partitioned database. |
| Details area | Displays graphs and tables describing the row selected in the Main area. |
| Details area tabs | Allows switching between the different views (Overview, Application) |
About the Main area in the Dashboard tab
The database table displayed in the Main area lists all the databases or partitions that are monitored by Precise for DB2. Each row corresponds to a database or database partition. The All row displays the average activity and the average availability (%) of all database partitions.
The following table displays information on the different database partitions in the application.
Table 2 Database partitions table
| Column name | Description | Sortable |
|---|---|---|
| Status | Icon representing the status of the collector (running, stopped, starting, etc.) | No |
| Server | Name of the server on which the database partition is running. | Yes |
| Database partition | <instance>.<database>[.number] | Yes |
| In DB2 (summed) | Stacked bar of 'In DB2' data with regular 3 display modes. Information limited to time frame. | Yes |
| Executions | # of statements executed in time frame. This value is taken from db-stats information. | Yes |
| Total lock time | Time period this database partition spent in lock wait. | Yes |
| Multi-partitioned | Icon representing if this is part of a multi-partitioned installation or not. | Yes |
| Availability | % of availability (0-100) | Yes |
| Catalog partition | Name of the database partition (see format above) which contains the database catalog. For single partition, this column will be left blank. | Yes |
When you open the Dashboard tab, only the first six columns are displayed. To view additional columns (such as: Executions and Last Update columns), use the left and right arrows to the right of the column titles.
About the Details area in the Dashboard tab
The Details area displays information on the database or partition selected in the Main area. It has two tabs: an Overview tab and an Application tab.
If you select the All row, the information displayed reflects the average availability of all Database Partitions.
The Overview tab
The Overview tab displays information in three views:
- In DB2 (summed). Displays database activity over time. Each time period is divided according to the ‘In DB2‘ groups (using CPU, locks, etc.).
- Top consumers. Displays the top statements and objects (tables/indexes) using database resources.
- Bufferpool activity. Displays the overall activity of each bufferpool.
The In DB2 (summed) view
This graph displays the database partition In DB2 activity over time, split according to normal In DB2 division.
The Top consumers view
The following table describes the different elements of the Top consumers table.
Table 3 Top consumers table
| Column name | Description | Sortable |
|---|---|---|
| Launch | Launch to the activity's statement or object. You will see activity over time. From a statement, launch to the SQL tab. From an Index or Table, Launch to the Activity tab. | No |
| Consumer Type | Table, Index or Statement. | Yes |
| Text | Table name, index name or statement unformatted text. | Yes |
| In DB2 (summed) | In DB2 time consumed by the object during the time period. | Yes |
| % | % (0-100) representing the percentage of time (of the total In DB2 time of the database partition) spent on that statement or object. | Yes |
| Executions | Total statement executions within the selected time frame. Available for statements, tables, and indexes. | Yes |
The Bufferpool activity view
The Bufferpool activity view displays the activity of each bufferpool in the system.
When clicking the view’s heading (Bufferpool activity), we launch to activity and view the comparison screen of the bufferpools, at the database partition level.
The following table describes the different elements of the Bufferpool activity table.
Table 4 Bufferpool activity table
| Column name | Description | Sortable |
|---|---|---|
| Launch | Launch to activity's bufferpool. You will be able to see the bufferpool's activity over time. | No |
| Name | The bufferpool name. | Yes |
| Total I/O time | A stacked bar of I/O time break into the following:
| Yes |
| Hit ratio | Bufferpool hit ratio. | Yes |
| Size | Bufferpool size (in MB). | Yes |
| Bufferpool size (in MB) | Bufferpool page size. | Yes |
| Response Time (Avg) | Bufferpool’s average response time. | No |
| Logical Read | Logical reads. | Yes |
| Total I/O Count | Bufferpool’s total I/O count, broken down into the following:
| Yes |
| Physical Reads | Total physical reads. | Yes |
| Pages | Number of pages. | Yes |
The Application tab
The Application tab displays information in three views:
- Programs
- Modules
- DB Users
All views share the same columns headings. The following table describes the different elements of these tables.
Table 5 Application tab tables
| Column name | Description | Sortable |
|---|---|---|
| Program | Name of the program. | Yes |
| In DB2 (summed) | The In DB2 view displays a stacked bar graph on the In DB2 resource consumption over time, for the selected time frame, broken down into the In DB2 application states. | Yes |
| % | Percentage of time the program took out of the total In DB2 time for the selected database partition. | Yes |
| Executions | Number of program executions. | Yes |
| Applications | Number of applications opened by the program. | Yes |
If you are working with SAP and ERP support is installed, the Application tab is named SAP instead, and the entities displayed are Work Types, Transactions, and Modules.
Launching from the Dashboard to other tabs
When you open the Dashboard tab and select a row on the Main area (left pane) and then click on another tab, the target tab is opened in the context of the selected database partition.
How the Dashboard can help you identify performance problems
You can identify a performance problem by doing one or more of the following:
- Identifying the most resource-consuming database partition
- Analyzing top resource consuming entities
- Analyzing buffer pools
- Identifying the top resource consumers in various entities
Identifying the most resource-consuming database partition
Precise for DB2 enables you to determine which are the most resource-consuming database partitions, indicating a potential performance problem.
The following example shows how to determine which database partition consumes the most resources. This example can show the top resource-consuming database partition, as measured by the total time spent executing In DB2.
To identify the most resource-consuming database partition
- In the Database Partition list, choose the Database Partition you want to analyze.
- In the Time Frame list, choose the period of time you want to analyze.
- In the Database Partition Details area view the In DB2 (Summed) overtime resource consumption graph. You can then launch to the Activity tab to check what the application was doing during the specified time period.
- In the Database Partition Details area view the Top Consumers grid to see which were the top statements and objects (tables and indexes) that consumed most of the resources. Then launch in context to the SQL tab to further investigate the heavy statement, or directly launch in context to the Activity tab to see which statements were using the heavy object.
- In the Database Partition Details area view the Buffer pool Activity grid to see which buffer pools were most active, and what are the statistics regarding these buffer pools. Then launch in context to the Activity tab to view overtime and extended information on these buffer pools.
- Use any of the following options to investigate further:
- Launch to the Statistics tab for the selected database partition.
- Launch to the Activity tab to check what the application was doing at the specified time.
Analyzing top resource-consuming entities
Precise for DB2 enables you to determine which are the most resource-consuming statements and objects (tables and indexes), as measured by the total time spent executing In DB2, indicating a potential performance problem.
The following example shows how to identify the top consumers that are the most resource-consuming statements and objects.
To identify the top resource consumers (statements and objects)
- In the Database Partition list, choose the Database Partition you want to analyze.
- In the Time Frame list, choose the period of time you want to analyze.
- In the Database Partition Details area view the Top Consumers grid to see which were the top statements and objects (tables and indexes) that consumed most of the resources.
- In case of a heavy statement directly launch in context to the SQL tab to further investigate the heavy statement.
In case of a heavy table or index directly launch in context to the Activity tab to see which statements were using the heavy object.
Analyzing buffer pools
Precise for DB2 enables you to determine which are the most activated buffer pools. It also presents additional statistics-related information on each buffer pool, such as hit ratio, average response time etc.
The following example shows how to identify the top active buffer pools. To identify the top active buffer pools
- In the Database Partition list, choose the Database Partition you want to analyze.
- In the Time Frame list, choose the period of time you want to analyze.
- In the Database Partition Details area view the Buffer pool Activity grid to see which were the most active buffer pools. Examine additional statistics information on the active buffer pool.
- In case you are interested in other statistics (e.g. the hit ratio), order the grid according to the required column.
- Launch directly to the Activity tab (using the launch icon) to view overtime and additional information on the specified buffer pool. Then drill from there to tablespaces and objects to see which were the most activated tablespaces and objects within the specified buffer pool.
Identifying the top resource consumers in various entities
A look at the Applications tab quickly helps you identify the top resource-consuming entities. The following example shows how to identify the top resource-consuming entities.
To identify the top resource consumers in various entities
- In the Database Partition list, choose the Database Partition you want to analyze.
- In the Time Frame list, choose the period of time you want to analyze.
- In the Database Partition Details area, click Applications. For example, a SAP database, PS8 on hp8, is monitored by a SAP extension.
The Application tab shows the following SAP-related top entities:
- Background work type
- SAP user SUPER
- Transaction SAP_CCMS_MONI_BATCH_DP
Most likely, these entities are related. - To investigate further, click an entity to launch the Activity tab. In the Activity tab you can confirm the connection between the problematic entities. For this example, you can identify a background transaction run by the SAP CCMS administration tool.