This section includes the following topics:
About Alerts
In a world where organizations rely on their information systems, avoiding problems that affect service to end-users is of prime concern. Proactive monitoring enables organizations to avoid such conditions by predicting potential problems before they occur. It focuses on identifying conditions that may lead to problems or that indicate that a problem may develop and enables you to implement corrective solutions before problems surface.
Alerts achieves this by focusing on the:
- resources and objects of the sampled devices
- way your applications use those nodes to detect potential bottlenecks
Improved performance management
IT and operations staffs frequently ask questions such as, "I cannot sit next to my console day and night looking for problems in the system. How can I find out immediately when something goes wrong," and "How can I find out a performance problem exists before receiving complaints from our end-users?"
Using Precise Alerts, IT and operations staffs can focus their valuable time on other activities. Alerts continuously and proactively monitors the health of critical applications.
When Alerts detects a performance problem, it will warn you before the problem affects the service to your end-users. Alerts can even draw your attention to performance problems that occur overnight or while you are away from your desk. To do so, Alerts sends you an email or an SNMP message. In addition, Alerts automatically logs all alerts to keep you fully up-to-date on system performance, no matter when a problem occurred.
When the threshold of a performance metric is exceeded, Alerts alerts you and triggers a user-defined automatic response. You can define thresholds and sampling frequencies for performance metrics using the Alerts user interface, without having to customize the code of your application.
Integrating with other Precise products
Precise consists of the following product suite:
- Alerts
- Report Manager
Alerts and Report Manager are used to support the Detect stage of the Precise methodology. They will alert you to performance problems early in their development and provide you warehouse-type information to support long-term profiling, trend and capacity analysis.
- Precise Custom Portal
The Precise Custom Portal is a lightweight, configurable portal application that provides access to various types of data from different applications. The Precise Custom Portal features a Web-based view. It is highly customizable and extensible, allowing you to build a dashboard for each user or each function within your organization. For example, you can build a dashboard for all the information that a system administrator or director of IT operations would need to constantly follow up on. This component is automatically installed as part of the Precise framework installation.
- Insight
Insight products monitor the response times of systems and break these times down into the various tiers and components. Insight products also provide tier-specific metrics to help understand the activities in each tier.
- Precise for Web
- Precise for SAP
- Precise for J2EE
- Precise for Microsoft .NET
- Precise for Oracle
- Precise for DB2
- Precise for SQL Server
- Precise for Sybase
These "Precise for" products provide a way to drill down into problematic tiers to identify and isolate root causes of performance problems. They can also assist in identifying and assessing solutions.
Components of Alerts
Precise Alerts uses a distributed architecture that enables you to monitor performance in your entire application from a single control point.
The following figure illustrates the Alerts architecture.
Figure 1-1 Alerts typical architecture
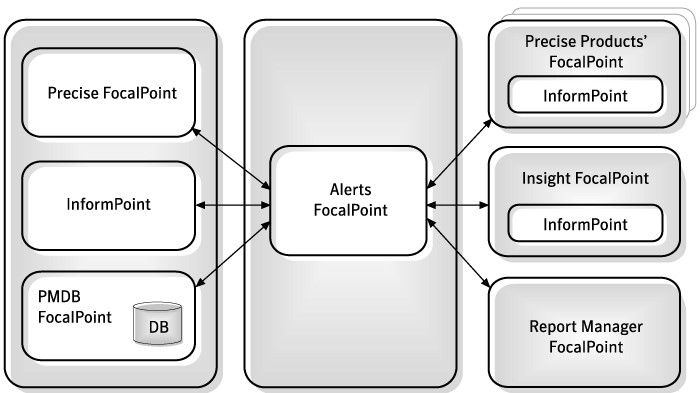
Alerts consists of the following components:
- Precise FocalPoint and a Web server that communicates with the client's browser.
- One Alerts FocalPoint that is installed on a system server or a dedicated server.
- InformPoint agents that are installed on one or more servers in your application. These InformPoint agents sample information from all Precise products (only one agent installation is required for each server).
- One InformPoint agent that is automatically installed on the server where Alerts FocalPoint is installed. This InformPoint agent samples the Status set metrics, and is also available for sampling metrics of Precise products. If this InformPoint agent is uninstalled, the metrics of the Status set metrics will not be available. For more information, see Status set.
- One or more Internet Explorer windows may be activated on the client-side. Working with Alerts, you may open as many clients as you want.
Precise FocalPoint
Precise FocalPoint is the main FocalPoint of all Precise suite products. FocalPoint is a Precise infrastructure component that communicates with its own distributed agents, each of which gathers information from the other Precise agents on a Tier and stores it locally.
Alerts FocalPoint
Alerts FocalPoint collects data from all InformPoint agents, stores it, and then processes it according to user requests. By processing data in its FocalPoint, Alerts keeps the consumption of your system's resources at a minimum.
The Alerts FocalPoint software consists of the following components:
- PMDB
- Alerts FocalPoint Processes
PMDB
Alerts FocalPoint stores the sampled data, which is collected by the Alerts agents, in the PMDB. In addition, it stores all Alerts configuration data.
Alerts FocalPoint processes
The Alerts FocalPoint processes perform the following functions:
- Processing sampled data retrieved by InformPoint agents from Precise products. FocalPoint writes the data it receives into the PMDB and, if required, generates actions.
- Communicating with the user interface. Requests issued by users are sent using the user interface to Alerts FocalPoint. The Alerts FocalPoint processes obtain relevant data from either the PMDB or the InformPoint agents, process the data, and send it back to the user by using the user interface.
- Maintaining the PMDB by periodically purging old data.
- Generating pre-defined actions such as:
- Sending email messages.
- Displaying popup messages on any open Alerts user interface.
- Running a program on the FocalPoint server and on the servers where the instance is running.
- Sending SNMP traps to any SNMP-based management system.
When SNMP is enabled, then Alerts FocalPoint can receive SNMP Get and Set requests, to read or update the PMDB accordingly.
InformPoint agents
The InformPoint agents collect performance data in your system by running pre-defined (generic) metrics and user-defined metrics (customized metrics).
The InformPoint agents process the retrieved data and report to the Alerts FocalPoint. Alerts FocalPoint then correlates this information to provide the current status of the different instances' performance in your application and to alert you to any problematic changes.
The other agents of Precise products collect and process the performance data of the monitored instance and send it to the appropriate FocalPoint of the Precise product. InformPoint, which is installed on the same server as the product's FocalPoint, requests data for all the instances monitored by that product directly from the product's FocalPoint.
Customized Metrics are designed to be executed on the instance server. An InformPoint agent must only be installed on the sampled instance server (using the Agent Installer) if one or more customized metrics for sampling the instance will be defined. For sampling all other Precise product metrics, InformPoint will be installed automatically on the same server of the Precise product FocalPoint server as part of the Precise product FocalPoint installation. InformPoint should not be installed manually using the Server List page (the third stage in the Precise Agent Installer process) if no customized metrics are going to be defined for sampling instances on this server.
The following figure illustrates the typical architecture of InformPoint agents.
Figure 1-2 InformPoint agents
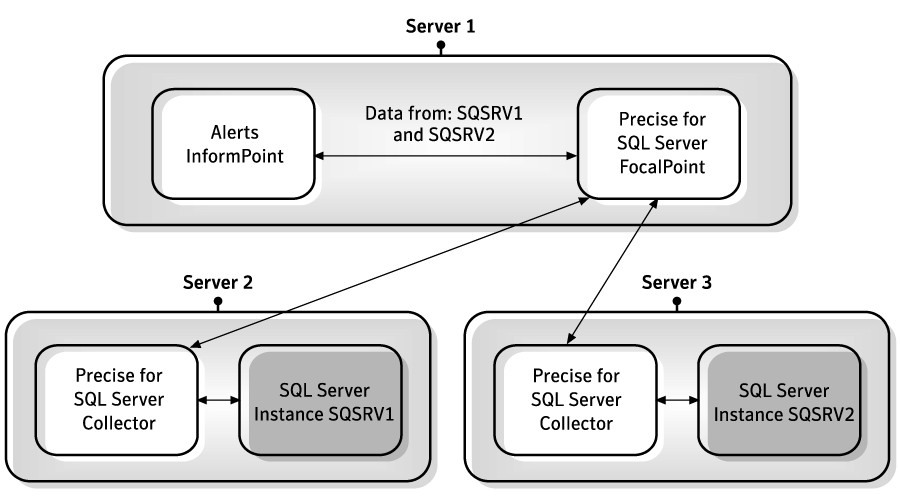
In this example, Alerts monitors a Precise for SQL Server installation. The Precise for SQL Server installation includes two instances on different servers, SQSRV1 and SQSRV2. To enable Alerts to monitor the Precise for SQL Server product, an InformPoint agent is installed on the Precise for SQL Server FocalPoint (Server 1). Alerts InformPoint collects the alerts data from the Precise FocalPoint product.
For more information, see Creating customized metrics.
How Alerts works
Alerts proactively monitors the performance in your application from a centralized location called Alerts FocalPoint. Alerts agents—called InformPoints—query all Precise products. The InformPoints retrieve performance data collected by the Precise products, analyze it, and generate alerts if the predefined thresholds are exceeded.
These alerts are then sent to Alerts FocalPoint, which processes the information, saves it in a local database, and activates any action that is defined for the specific alert.
Once a metric is sampled, the value of the metric is compared to a predefined set of values called thresholds. When the value of the metric exceeds one of the metric’s threshold values, an alert is generated and the status of the metric is changed to near-critical or critical.
Metrics are grouped into metric sets. The status of the metric set is the overall status of its metrics. You can monitor the status of metric sets and metrics through the Alerts tab.
To proactively monitor your application, you can define actions that Alerts will automatically perform if it detects a warning or critical status for a specific metric. For example, you can configure Alerts to send an email message, display a pop-up message, run a program, send SNMP traps, or send MOM alerts to the MOM Server.
You can change the default properties of a metric to suit the special requirements of your application. For example, you can change the near-critical and critical thresholds and limit information to be included.
Another important aspect of monitoring is a look at the overall activity to identify current performance problems and compare the load and service of different components.
Where to get more information
More information on Precise, its products, technical notes, and so on, can be found in the Release Notes for this version.