This section includes the following topics:
- About Precise for SAP
- About Precise for SAP components
- How Precise for SAP works
- Where to get more information
About Precise for SAP
Precise for SAP offers a wide range of data presentations that provide IT professionals with the information necessary to manage SAP client/server systems. Precise for SAP analyzes SAP system performance and applications and helps you to effectively direct resources and enhance system use.
Precise for SAP collects accurate, up-to-date management information from the SAP system and network and stores this information in the PMDB.
The Precise user interface makes the data available as a series of views accessible from a standard web browser. Information is organized according to your company's business structure, geographic locations, and SAP system characteristics. It can provide the views that show information according to your enterprise's departments or business organizations. In addition, it can show information by location or according to application server performance or the service provided to users of a specific application. Basic information about your business organization, departments, and the key network locations to be monitored must be provided to the Precise for SAP application. This ensures that it generates appropriate views and provides optimum analysis.
Improved performance management
IT staff frequently search for answers to questions like Why did the user experience poor response time yesterday? or Where is the transaction spending the most time?
Precise for SAP can help IT staff find the answer to these questions. The first step is to establish a baseline level of SAP transaction consumption by understanding the behavior of the average SAP transaction.
The behavior of the average SAP transaction represents the average percentage of the total time that all SAP transactions spend consuming or waiting for each resource. These aggregate figures provide a broad picture of the operation of your SAP system. They enable you to identify major bottlenecks in your SAP system. For example, long queue time due to lack of SAP processes, long database time due to missing database resources, poor application servers availability, etc.
Precise for SAP also enables you to focus on and drill down to individual transactions, users, organizations, locations, application server, or applications in your system that are responsible for heavy consumption of system resources. This lets you find the definitive root cause of performance degradation.
Integrating with other Precise products
Precise for SAP has been integrated with Precise Insight, Alerts, Report Manager, Precise Custom Portal, Precise for SQL Server, and Precise for Oracle in addition to the PMDB.
Alerts provides a notification system that alerts you to application response time problems and enables you to launch in context to view more detailed data. For more information, see the Alerts User's Guide or Online Help.
Report Manager gathers and organizes historical the information that enables the IT team to focus on infrastructure hot-spots. Report Manager is a reporting tool that resides on a Web server. You can use Report Manager to compare period-to-period performance against a baseline and identify response time problems at-a-glance, before they affect your bottom-line. It queries the PMDB and displays the results in the reports that are generated on a scheduled basis or on demand.
The Precise Custom Portal is a lightweight, configurable portal application that provides access to various types of data from different applications. The Precise Custom Portal features a Web-based view. It is highly customizable and extensible, allowing you to build a dashboard for each user or each function within your organization. For example, you can build a dashboard for all the information that a system administrator or director of IT operations would need to constantly follow up on. This component is automatically installed as part of the Precise framework installation. For more information, see the Precise Custom Portal User Guide.
Precise for SQL Server allows you to go into the detailed transaction information that is contained in the SQL database while maintaining the context you have specified while working in Precise for SAP. For more information, see the Precise for SQL Server User's Guide or Online Help.
The PMDB is the repository of the Precise for SAP suite, which stores application performance data for long-term analysis and trending reports. The data collected by the Precise product suite. For more information, see the Precise Administration Guide or AdminPoint Online Help.
About Precise for SAP components
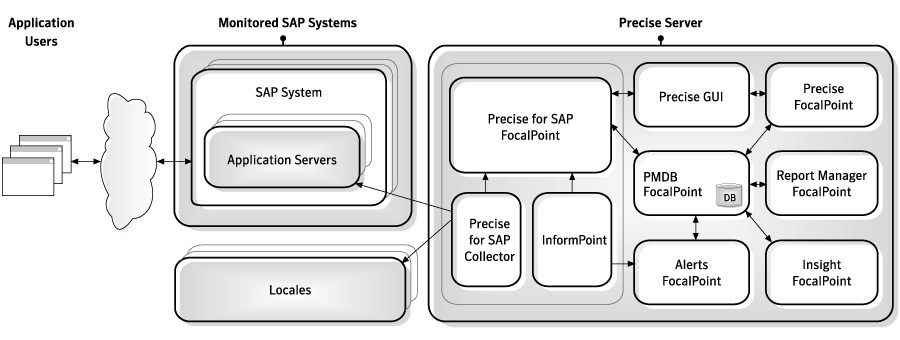
Precise for SAP employs a client/server architecture to provide high performance database monitoring and tuning. Precise for SAP consists of the following components:
- Precise for SAP Collector agents and one Precise for SAP FocalPoint agent installed on a Windows server in your application.
- PMDB.
- As part of the Precise product suite—Precise FocalPoint, Alerts FocalPoint, Report Manager FocalPoint, and Insight FocalPoint. Precise for SAP is fully integrated with Precise products, allowing you to view SAP activity in Precise Insight, receive alerts using Alerts, and examine SAP activity reports within Report Manager. For more information, see the relevant product manual.
The following figure illustrates the typical architecture of a Precise for SAP installation.
Figure 1 Precise for SAP Architecture
About Precise for SAP Collectors
Precise for SAP Collectors are implemented as NT services (no support is provided for UNIX Collectors). The Collectors can only reside on a Windows OS machine (they do not need to be installed on an SAP application server). See Precise minimum requirements for installation.
One Collector can collect data from many remote SAP systems. The Collector stores the data it collects into cache files in the LOG folder.
The following table describes the various Collectors.
Table 1 Collectors
| Collector | Description |
|---|---|
| Workload | The Workload Collector is the most important Collector in Precise for SAP. It performs remote function calls to gather performance information about all SAP systems. The Workload Collector collects:
|
| Availability | The Availability Collector supplies the availability data of each and every application server in all monitored SAP systems. The Collector calls an RFC Ping method to check for application server availability. This data is then written to the cache files and aggregated in the FocalPoint before being loaded into the PMDB. The application server availability data is computed along with the locale availability data to produce overall system availability data. |
| Locale | The Locale Collector supplies network information. When a locale is configured, destination machines are configured for that locale. The Locale Collector pings these destination machines using the TCP/IP method and returns information about the availability of these destinations. This data is then written into the cache files and aggregated by the FocalPoint before loading it into the PMDB. The aggregated data is used as the locale availability information for Precise for SAP. It is also computed together with the application server availability to produce overall system availability data. |
About the Precise for SAP FocalPoint Manager
The FocalPoint Manager handles several unrelated tasks:
- Answering data requests from GUI or other Precise products.
- Performing infrastructure tasks (installation and agent manager tasks).
About the Precise for SAP Data loader
The Data loader loads the collected data, processes the data, and prepares it for loading into the PMDB. Prior to the statistics load process the Data loader is in charge of processing the data collected.
The Data loader performs the following tasks:
- Summarizes data by time slices.
- Manages the dimension tables (substituting identifiers by keys and adding new dimension records if they don't exist).
- Transforms the union dialog steps into business transactions.
- Calculates SLA values for business transactions.
- Determines the planned downtime status for each availability time slice.
- Converts the time to FocalPoint GMT time.
How Precise for SAP works
Precise for SAP stores a complete history of your SAP system activity in the PMDB. This provides you with a performance tracking tool. It gives you the ability to assess SAP system performance trends and analyze changes in SAP system activities over long periods of time. This data is vital for identifying patterns in resource consumption and predicting future resource consumption in your SAP system.
Precise for SAP employs a client/server architecture to provide comprehensive 24 x 7 performance monitoring, vital for both short and long-term monitoring of your SAP system.
The Precise for SAP Collector agents run from a remote dedicated server. This server connects to your systems application servers using a low overhead, accurate, and comprehensive sampling technology (no software components are installed on your application server machines). The server collects performance and availability data from your SAP system. It is then analyzed and summarized. You can later access this data using the user interface to perform long-term evaluations of performance.
Where to get more information
More information on Precise, its products, technical notes, and so on, can be found in Precise Release Notes for this version.