This section includes the following topics:
- About Precise for Sybase
- Components of Precise for Sybase
- How Precise for Sybase works
- Where to get more information
About Precise for Sybase
Addressing the needs of DBAs, system administrators, managers, quality assurance specialists and planners, Precise for Sybase provides a complete view of application performance by capturing, measuring, and correlating performance metrics from all critical system components.
Precise for Sybase offers a wide range of data presentations to enable quick and accurate monitoring and performance analysis.
Current operational data is displayed to enable easy identification of problematic conditions. Recent operational data, for designated time periods, supplements operational data to enable operations staff to detect problematic conditions that occurred in the past and that are likely to occur again and again, if not corrected.
Performance data is archived and a fully detailed display of the historical data is provided for use in performance, QA and capacity planning analysis.
Improved performance management
IT staff frequently search for answers to questions like "Why did the application run so slowly last night?" or "Where is the application spending its time?"
Precise for Sybase can help IT staff find the answer to these questions. The first step is to establish a baseline level of database resource consumption by understanding the behavior of the average application. The behavior of the average application represents the average percentage of the total time that all applications spend consuming or waiting for each resource. These aggregate figures provide a broad picture of the operation of your database. They enable you to identify major bottlenecks in your system, for example, CPU and I/O limitations, Sybase database waits due to locks, remote queries, and so on.
Precise for Sybase also enables you to focus on and drill down to individual applications, SQL statements and database objects in your system that are responsible for heavy consumption of system and database resources and to quickly find the definitive root cause of performance degradation.
Integrating with other Precise products
Precise for Sybase has been integrated with Alerts, Precise Custom Portal, and Report Manager in addition to the PMDB.
Alerts provides a notification system that will alert you to application response time problems and enables you to launch Precise for Sybase in context to view more detailed data.
For more information, see the Precise Alerts User Guide. The Precise Custom Portal, is a lightweight, configurable portal application that provides access to various types of data from different applications. The Precise Custom Portal features a Web-based view. It is highly customizable and extensible, allowing you to build a dashboard for each user or each function within your organization. For example, you can build a dashboard for all the information that a system administrator or director of IT operations would need to constantly follow up on. This component is automatically installed as part of the Precise framework installation. For more information, see the Precise Custom Portal User Guide.
Report Manager gathers and organizes historical information that enables the IT team to focus on infrastructure hot spots. Report Manager is a reporting tool that resides on a Web server. You can use Report Manager to compare period-to-period performance against a baseline and identify response time problems at-a-glance, before they affect your bottom-line. It queries the PMDB and displays the results in reports that are generated on a scheduled basis or on demand. For more information, see the Precise Report Manager User Guide.
The PMDB is the repository of the Precise for Sybase suite which stores application performance data for long-term analysis and trending reports. The data is collected by the Precise product suite. For more information, see the Precise Administration Guide.
Components of Precise for Sybase
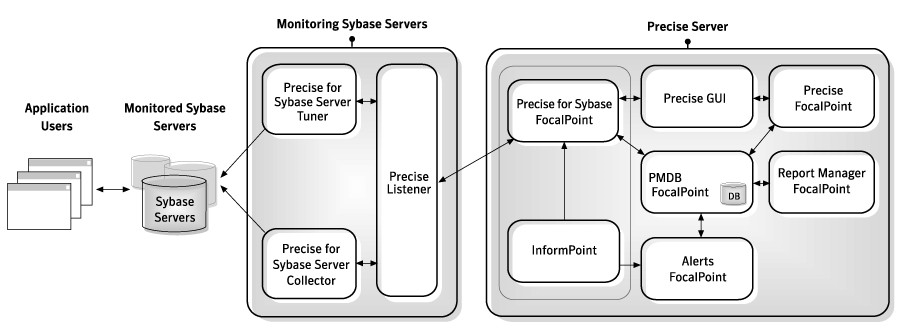
Precise for Sybase employs a client/server architecture to provide high performance database monitoring and tuning. The following figure illustrates the typical architecture of Precise for Sybase.
Precise for Sybase consists of the following components:
- One or more Precise for Sybase Collector agents installed on one or more servers in your application
- Precise for Sybase FocalPoint
- PMDB
The figure below illustrates the typical architecture of an installation.
Figure 1 Precise for Sybase architecture
Precise for Sybase agents
The Precise for Sybase Collector agent is installed on the monitoring server machines and communicates using TCP/IP. The Collector agent collects and analyzes Sybase database performance data, which is then stored in flat historical files and later in the PMDB.
The Collector agent monitors and records all Sybase database activity on a 24 x 7 basis. The Collector agent works using a sampling technique and thereby consumes less resources than a trace agent.
The Collector agent collects resource consumption data on the following Sybase data entities: databases, sessions, programs, statements, batches, login names, DB users, and machines.
The Precise for Sybase Collector agent uses the following sources to collect performance data:
- Sysprocesses. This system table provides information regarding the resource consumption in Sybase.
- Monitor server/Monitoring Tables. The Monitor server provides the text of the improvised batches, executed in Sybase. It is being used for monitoring Sybase instances below version 12.5.0.3. From version 12.5.0.3 the monitoring tables are being used for the same purpose.
The resource consumption data and the text batches are correlated according to the batch ID of the two resources.
The text of the Stored Procedures is taken from the Syscomments system table.
Precise Listener and Precise for Sybase FocalPoint
Each Precise product has a FocalPoint that communicates with the Listeners installed on the monitored servers. The Precise Listener communicates with other Precise components on the same server. For example, the PMDB FocalPoint requests to load data into the PMDB are sent to the Precise Listener. Then, the Precise Listener executes the PMDB Loader to aggregate and prepare performance data to be loaded.
PMDB Loaders
PMDB Loaders periodically load data, collected by the Collector and stores it in the historical files, into the PMDB. When the PMDB Loaders run, the flat historical files, written after the last time data was loaded into the PMDB, are identified and opened. The summarized data is also loaded into the PMDB. Data on the last incomplete time slice is only loaded into the PMDB when the next scheduled load process runs.
How Precise for Sybase works
Precise for Sybase stores a complete history of your database activity in the PMDB. This provides you with a performance tracking tool that gives you the ability to assess database performance trends and analyze changes in database activities over long periods of time. This data is vital for identifying patterns in resource consumption and predicting future resource consumption in your Sybase database.
The Precise for Sybase Collector agent runs on your monitoring server machine, using a unique, accurate and comprehensive sampling technology, that requires low overhead. It collects performance data from an instance and then correlates and loads the data into the PMDB tables. This data is then analyzed and summarized by the FocalPoint. You can later access this data using the Precise for Sybase Web browser interface.
Where to get more information
More information on Precise, its products, technical notes, and so on, can be found in the Release Notes document for this version.