This section includes the following topics:
- About Precise for BW
- Features of Precise for BW
- Pre-installation requirements
- The Precise for BW user interface
About Precise for BW
Precise for BW has been specifically designed to enable you to easily troubleshoot BW performance problems. Precise for BW provides more visibility into the following key BW components:
- ETL (Extract, Transform, Load) operations
- Process Chains and their respective Processes
Often you encounter slow ETL processes and want to examine these operations with a full end-to-end perspective. Support for Process Chains from the data source (Source System) to the BW system including full correlation and execution time breakdown helps you troubleshoot slow ETL operations.
The value of the Precise for BW solution comes from combining BW statistics and technical content with Precise metrics. A logical and easy to use user interface is provided to show you where slowdowns or SLA breaches have occurred, guiding you step-by-step to the root cause of the problem.
The Precise solution supports production applications and provides end-to-end visibility for Process Chains. Other areas addressed by the Precise solution are slowdowns caused by load/query conflicts (leading to database locking situations) and application server overload situations caused by running too many Process Chains at the same time.
About common terms used in this manual
The following table describes common terms used in this wiki.
Table 1 Common terms used in this wiki
| Term | Definition |
|---|---|
| Alerts | Alarms raised by Precise for failed Process Chains or breaches/near-breaches of the SLA. The Alerts table, at the bottom of the main screen, displays all alerts raised by Precise. |
| CCMS | Central Control and Monitoring System. |
| Drilling down in context | Drilling down in context means that you can display additional information on a selected item by drilling down to another tab or view. The filter settings you define — for example, your selected BW instance and your selected time frame — are carried over to the other view or tab to allow you to continue analyzing the same subject from a different perspective. In other words, the information displayed when drilling down in context is always related to your original selection’s settings. |
| InfoPackage | An InfoPackage specifies when and how to load data from a given source system. |
| InfoProvider | Generic term for BW objects into which data is loaded or that display views of data. This data is analyzed using queries. An InfoCube is a type of InfoProvider. |
| MTE | Monitoring Tree Element. In CCMS Alerts, Monitors contain MTEs and MTEs contain Objects. |
| Process Chain | A sequence of background scheduled processes that are waiting to be triggered by an event. Process Chains are used for centrally controlling and monitoring processes. |
| Process | Building block of a Process Chain with a defined beginning and end. Processes are synchronized one to another within the Process Chain definition. |
| Source System | An operational system that is used as the source or input to the ETL process. The source system can be either a SAP or a non-SAP system. |
Features of Precise for BW
The following is a list of Precise for BW features:
- Provides a comprehensive view of BW performance without having to access multiple data sources separately
- Enables you to identify and resolve performance problems in the BW system before they impact user or business productivity
- Optimizes performance management from start to finish—from proactive monitoring and problem detection to problem isolation, analysis, and resolution
- Provides long-term historical data and trending for Process Chains
- Provides a logical and easy to understand user flow along with end-to-end data correlation and support, in particular for data load Process Chains
- Provides visibility into single processes — see associated background jobs running on the BW side and on the Source System
- Provides execution time broken down from database to database, including storage, so that bottlenecks can be quickly identified
- Provides a consistent user interface and user flow as well as drill-downs and correlated data
- Provides alerts in the form of email, specifying details of failures or SLA breaches
- Provides visibility into ETL breakdown
- Provides in context links launching to Precise for SAP (ABAP), Precise for DB, job logs, or Trend Analysis
- Integration with CCMS and Solution Manager
- Enables root cause analysis for slow/failed chains
- FLEX based user interface
Pre-installation requirements
For pre-installation requirements, see the Installing SAP Tier Collector section on page in the Precise Installation Guide.
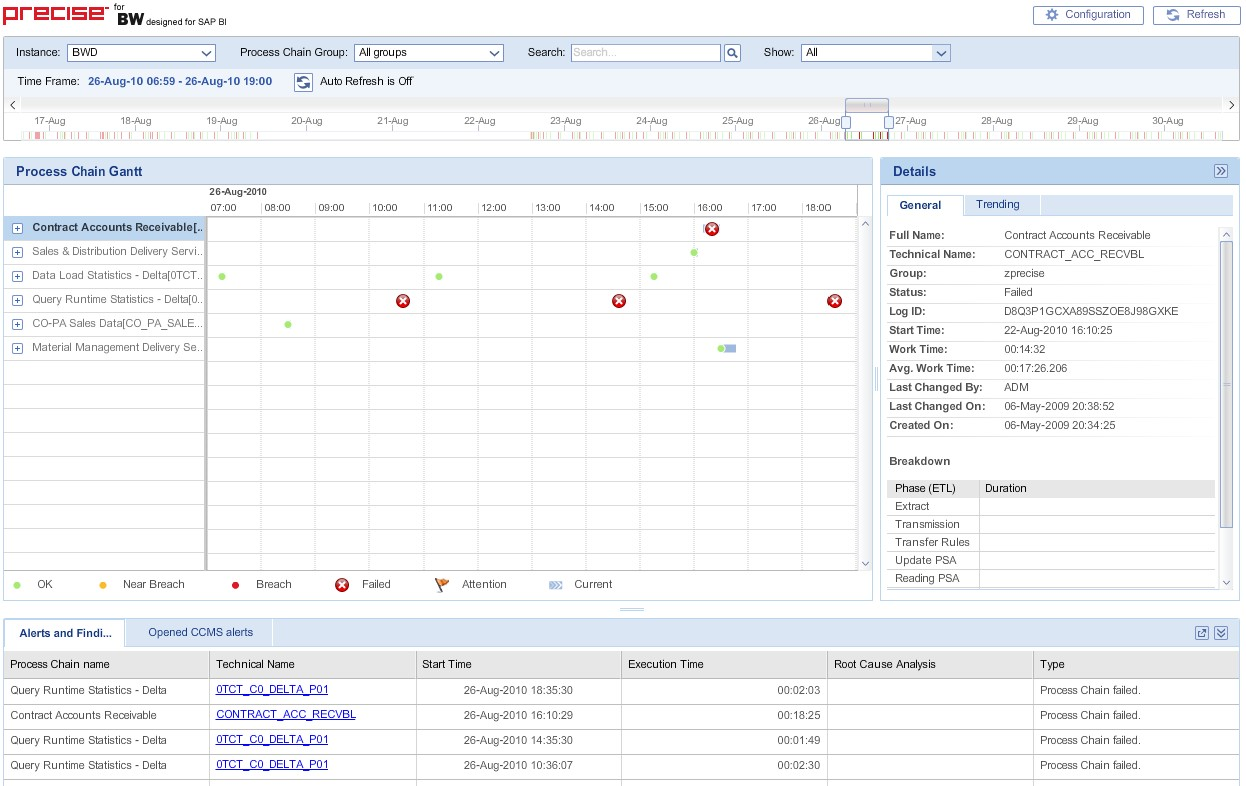
The Precise for BW user interface
Precise for BW allows you to easily troubleshoot BW performance problems by providing visibility into key BW components (e.g., ETL operations, Process Chains, Processes).
The following sections describe the Precise for BW user interface and its respective areas:
- About the Control area
- About the Tree area
- About the Gantt area
- About the Details area
- About the Alerts Table area
Figure 1 The Precise for BW user interface
About the Control area
The Control area includes elements that allow you to select the amount and type of information to display. It is in this area that you define the time frame to be displayed. Filters and search options give you further control over the scope of the information to be displayed and analyzed.
The Control area includes the following elements:
- Configuration button
- Refresh button
- Filters
- Search - Process Chains search box
- Time Frame
- Auto Refresh button
- Slider and Slicer
Configuration button
Click the Configuration button to open the Configuration dialog box. You can configure the following settings here:
Table 2 Configuration dialog box options
| Option | Description |
|---|---|
| Auto Refresh | Check to auto refresh, clear to disable auto refresh. |
| Refresh Rate (minutes) | Enter refresh rate in minutes (default is 10 minutes). |
| Overall time range (last X weeks) | Enter number of weeks (default is 4 weeks). |
| Slider time frame width (x weeks) | Enter the number of weeks you want to display on the Gantt area (default is 2 weeks). |
| CCMS Alerts | Select the check box to show only MTEs with CCMS alerts. Clear the check box to show all MTEs (default is selected). |
SLA and Email Alert settings are configured in the Precise AdminPoint. For more information, see the Configuring Precise for BW section on page in the Precise Administration Guide.
Refresh button
Located on the upper right-hand side of the screen. Click this button to refresh the information displayed and to update the Last Update time indicator.
Filters
The Control area of the screen includes three filters which affect both the Gantt and Alerts Table displays. The following table provides a short description of each of these filters:
Table 3 Filter definitions
| Filter | Description |
|---|---|
| Instance selector | Enables you to select the BW instance whose information you want to analyze. By default, the first Precise for BW instance on the list is selected. |
| Select Process Chain Group selector | Enables you to select Process Chains by their BW group. |
| Show: All/Processes with alerts selector | Enables you to select whether to display all executions (All Process Chains) or only executions with alerts (Only Process Chains with alerts). |
Search – Process Chains search box
Enables searching for specific Process Chains within the defined Overall time range. It includes a text box for specifying the search string (allows both friendly and technical Process Chains names). The text box supports only the * wildcard patterns (e.g., *abc*, A*b, *c). The Tree, Gantt, and Alerts Table areas display only the list of Process Chains executions that match the search criteria.
Time Frame
Three time frames have been defined to allow you maximum flexibility in viewing and analyzing the information. The following table describes each of them.
Table 4 Definition of the timeframes
| Name | Functionality | Default value |
|---|---|---|
| Overall time range | Defines the full extent of data to be displayed by the application. All data displayed on the screen will be within the selected Overall time frame. The scroll arrows to the left and right of the Slider let you scroll back or forward respectively within those dates. The Overall time range can be configured using the Settings button located on the upper right-hand side of the screen. See "Configuration button” on page 9. | 4 weeks |
| Slider time frame | The Slider is located at the bottom of the Control area. It displays the amount of weeks defined in the Slider time frame setting. The Slider time frame can be configured using the Settings button located on the upper right-hand side of the screen. See “Configuration button” on page 9. | 2 weeks |
| Slicer time frame | The Slicer time frame determines the date range of information displayed in the visible Gantt area. The Slicer width can be expanded or contracted by dragging its arrows to the left or right. The Slicer position on the Slider can be changed by panning it left or right. This last action will not affect the defined date range (width) of the Slicer. See “Slider and Slicer” on page 10. | 12 hours |
Auto Refresh button
Turns Auto Refresh On/Off. Same functionality as the Refresh button but offers you the choice to automatically refresh or not.
Slider and Slicer
The Slider and Slicer are part of an over-time bar located at the bottom of the Control area. They are designed to give you maximum visibility and flexibility in viewing the analyzed data. The Slider enables you to scroll through the Overall time range from beginning to end. The Slicer determines what ‘slice’ of time you choose to display on the Gantt area. In other words, the wider the Slicer setting, the more information (time wise) that is displayed on the Gantt. Additionally, the Slider displays the status of Process Chains as follows: Green if OK, Red if more than one Process Chain is red, Yellow if more than one Process Chain is yellow, and no color if there are no active Process Chains.
About the Tree area
The Tree area is located on the left side of the screen in front of the Gantt area. It has two levels: the first level displays Process Chains and the second level displays Processes. By default, only the first level or Process Chains are displayed.
Expanding a Process Chain to display its Processes is accomplished by clicking the arrow on the left side of the icon. Expanding a Process Chain also expands the Gantt to display all Process executions.
About the Gantt area
Each Process Chain/Process execution is represented by a bar on the Gantt. Currently executing Process Chains are displayed if they are active during the Gantt timeframe.
About conventions used
Process Chains, as well as their Processes, are sorted by the end time of the last execution in descending order. Current Process Chain’s end time is now, thus they will be on top.
The color of Process Chain icons is determined by the SLA status of its execution:
 OK
OK
 Near-Breach
 Breach
 Failed
A red flag icon calls your attention to information you need to be aware of.
An icon at the end of an execution bar differentiates a currently executing Process Chain from a completed Process Chain.
A light blue bar indicates the Process Chain execution’s duration. When a Process Chain has breached or near-breached, a vertical line is displayed indicating the breach point. Bars in the Gantt are selectable and affect the Details area. For more information, see “About the Details area” on page 11.
If you hover with the mouse over an icon in the Gantt area, a tooltip is displayed indicating its name, SLA value (for Process Chains only), start and end time, and its duration. By default, the Gantt area displays the latest data.
A legend at the bottom of the Gantt area displays all the icons used in the Gantt.
Viewing individual executions
You can view information on individual executions by either hovering over the execution bar or by clicking on it. Hover over the bar to view general information (displays a ToolTip with the Process Chain’s Full Name, Start and End times, Near-Breach and Breach settings, Log ID, and Duration). Click on the bar to view detailed information in the Details area.
About the Details area
The Details area is located on the right side of the screen at Gantt level. It is a context sensitive area displaying details of the selected Process Chain execution or Process execution.
The Details area can be either enlarged or reduced by dragging the Details area resizer to the left or right respectively. This action will accordingly scale down or up the Gantt display without affecting the Slicer size or the data being displayed.
You can also hide the Details area by clicking the >> button on its upper right-hand corner.
Content
The following table describes the content displayed in the Details area according to the Process Chain or Process selected in the Gantt.
Table 5 Details area content
| Process Chain Selected | Process (not loading) selected | Process (loading) selected |
|---|---|---|
General tab:
Breakdown:
Trending tab:
| General tab:
| General tab:
ETL Breakdown tab: (Graphical) ETL Breakdown This table displays the duration of each phase of the ETL process. additionally, it provides links to additional information.
InfoProviders tab:
BI Activity pop-up screen: Displays a 3 column (Component, Duration, and Link) table with two rows:
|
Launches
Launches are represented by links labeled ‘Analyze’. Launches open in a new window. If components are missing for the launch, a popup screen informs you that the given component is not monitored by Precise. To enable the launch you must configure Precise to monitor the component(s).
Logs
Links to Logs open a pop-up window containing a table with a Timestamp column and a Message Text column. You can either copy the log to the clipboard for future pasting or you can print it directly.
If important messages in the log were identified, a flag is displayed next to the link. We recommend you read the log messages marked with this flag.
If the message information is truncated because of the column width, hover over it with the mouse and a ToolTip will display the complete information.
About the Alerts Table area
The Alerts table is displayed at the bottom of the screen. The vertical space it occupies on the screen can be either expanded or reduced by dragging the Alerts table resizer up or down respectively. This action will accordingly scale up or down the Gantt display without affecting the data being displayed.
The Alerts table includes two tabs: The Alerts and Findings tab and the CCMS Alerts tab.
Alerts and Findings
Precise Alerts raise an alert for any failed Process Chain or any breaches or near-breaches of the SLA. The table displays all alerts raised by Precise.
The time frame for the Alerts table is the Gantt timeframe. The Precise Alerts table displays the following columns:
- Process Chain Name – The name of the Process Chain.
- Technical Name – Process Chain Technical Name (Link). Clicking the name on this column triggers a scroll on the Gantt view to focus on the relevant execution.
- Start Time – The Process Chain start time.
- Execution Time – Execution time of the Process Chain.
- Root Cause Analysis – If available, clicking the link on this column displays a popup window with a root cause analysis description.
- Type – SLA breach, Near-breach, or Exception.
Clicking on a column header will sort the column. The table’s default sort is by the Alerts timestamp in descending order.
CCMS Alerts
Precise for BW displays CCMS alerts for the monitored instance. Only CCMS Monitors defined in a configuration file are displayed. The default monitors are:
- BI Accelerator Monitor
- BI Key Performance Indicators
- BI Monitor
To add more Monitors, see Configuring Precise for BW.
The left side of the CCMS Alerts tab displays a tree showing a list of active monitors. The right side displays a table showing all the Alerts for the selected entity (monitor) in the tree.
The CCMS Alerts table displays the following columns:
- Status – Warning or failed.
- Timestamp – Time of the alert.
- Context – Context in which the alert was raised.
- Alert text – Text of the alert.
- Object name – Name of the object.
- Short name – Short name of the monitored instance.
Clicking on a column header sorts the column. The default sort is by the alerts timestamp, in descending order. Filtering is allowed. If enabled, only nodes that have alerts are displayed. If not, all nodes are displayed. The filter is enabled by default. See “Configuration button” on page 9.
If there are no alerts in the entire tree, a message is displayed. Clicking on a node in the tree displays all the alerts for that node in the tree area. Expanding a node in the tree displays the children of that node in the tree. No change will occur in the table area.
Only open alerts are displayed. Time frame settings have no effect on the list. Closing an Alert or changing its settings from the user interface is not supported.
Pulling alerts from a Central Monitoring instance is supported. This is configured by indicating the instance name in the configuration file. For more information, see Configuring Precise for BW.