The section includes the following topics:
- Viewing a report
- Running a report
- Setting report properties
- Setting the schedule of a report generation
- Creating a copy of a selected report
- Creating customized reports
- Report Manager settings
Viewing a report
Report Manager displays generated reports in PDF format for pre-defined reports or in Microsoft Excel format for customized reports. You can view reports only in the Data view. The following procedure describes how to view reports that have already been generated at pre-scheduled times. See Creating customized reports and Running a report.
To view a report
- From the Tier Selection bar, select the Tier for which you want to view a report.
- From the Report Set Selector, select the Report Set that contains the required report. The Reports Table displays the reports of the selected report set.
- From the Reports Table, select the report you want to view and click View (or double-click the report). If the report is not yet generated or does not contain data (the Pages column indicates 0), Report Manager displays a message that allows you to rerun the report.
If the report is already generated and contains data (the Pages column indicates a number greater than 0) the report content is opened.
Running a report
Report Manager generates a report according to the settings of its properties. You can rerun a selected report with different property settings for that particular run. For example, you can rerun the report to include only specific counters and a specific Time Frame. See Setting report properties and Introducing Report Manager reports.
To run a report
- From a report view, click Rerun. The Properties for This Run dialog box is displayed. This dialog box contains similar tabs to the tabs of the report Properties dialog box (Description, General, Time Frame, and Filters).
- In the Properties for This Run dialog box, set the properties according to your preferences.
These settings affect only the current run of the report and do not affect the default properties of the report. - Click OK. Report Manager generates the report and then displays it.
Setting report properties
Report Manager keeps the properties for each report in the Performance Management Database. You can view and modify these parameters in the Properties dialog box.
The Properties dialog box includes the following tabs:
- Description. This tab contains the report description (read only).
- General. This tab includes parameters - specific to the selected report - that are neither time frame parameters nor filters. For example, you can specify the counters to include in the report and the number of entities to display.
- Time Frame. This tab contains parameters that define the time periods assigned to the various elements of the report.
- Filters. This tab includes parameters - specific to the selected report - that enables you to filter the data to include in the report, such as the instance filter and entity filter. A filter can include a list of wildcards, separated by commas, where a wildcard is a string, which may contain asterisks. The format used to filter Report Manager reports by instance is:
InstanceName(ServerName). For example: ORA92 (hp2). - Email. This tab includes a list of addresses for emailing the selected report. Check the Email box to send copies of the selected report to the listed addresses.
Type each address separately into the Address box and click Add to add the address to the Address list. The structure of the address is as follows: employee name@company address.
Click Remove to remove an address from the Address list.
To set report properties
- From the Reports Table, select a report and click Properties. The Properties dialog box is displayed.
- Set the properties in the General, Time Frame, Filters, and Email tabs, according to your preferences.
- Click OK.
The new settings are used the next time the report is generated.
Setting the schedule of a report generation
Report Manager runs reports, by default, on a daily basis at 6:00 AM, following the Performance Management Database daily summary process. You can modify the default schedule of a selected report through the Scheduling dialog box.
The Scheduling dialog box includes the following options:
- Once. Run only once in the selected date and time.
- Hourly. Run every hour at the specified minute, starting at the specified date.
- Daily. Run once a day at the specified time, starting at the specified date.
- Weekly. Run once a week at the specified day of the week and time, starting at the specified date.
- Monthly. Run once a month at the specified day of the month and time, starting at the specified date.
- Never. Never run the report.
To set the schedule of a report generation
- From the Reports Table, select the report and click Scheduling.
- Set the schedule for the selected report and click OK.
Creating a copy of a selected report
Each report is assigned with a set of properties and schedule. If you want to have more than one report of the same set (Profile, Exception, and so on) and the same entity, but with different properties and schedule, you can create a copy of the report, and then modify the properties and schedule of the report copy. See Setting report properties and Setting the schedule of a report generation.
To create a copy of a selected report
- From the Reports Table, select the report and click Save As.
- In the Report Name field, type a new name for the report copy.
- From the Tier list, select the Tier for which you want to assign the report copy.
You can assign the report copy either to the Tier of the original report or to the Cross-Tiers. - From the Set list, select the report set for which you want to include the report copy.
If you have selected the Tier of the original report in the previous step, you can include the report copy either to the original report set or to the Customized set. - Click OK.
Creating customized reports
Report Manager enables advanced users who are familiar with the data logic of the Tier to create customized reports, which include data that is not provided in the pre-defined reports.
You can create a customized report only when the Customized set is selected, or when the Cross-Tiers tab is selected.
To create customized reports
- On the Command buttons, click New.
- Define a query.
- Run and design a customized report.
After creating a customized report, you can modify and redesign it. See Editing an existing customized report.
Defining a query statement
Each report can execute multiple queries that determine the customized report data. A query definition - whose result is an SQL SELECT statement - includes the following elements:
- Summary level. Specifies the granularity level of the data: time slice, hourly, daily, weekly, and monthly.
- Report fields. Specifies the fields selected from the Data Tree to be included in the report.
- Filter. Specifies the filtering conditions that determine the data in the report.
You can add, rename, or remove queries using the buttons located to the right of the Query Selection box, in the customized report data selection page.
Table 1 Query selection icons
| Icon | Description |
|---|---|
 | Click to add a new query. |
 | Click to rename an existing query. |
 | Click to remove an existing query. |
To define a query statement:
- Set the summary level of your query. From the Summary Level box, select the view level for your report.
The Performance Management Database stores data in different levels of granularity: Time slice, Hourly, Daily, Weekly, and Monthly. This enables you to present a detailed view and progressively higher-level view of the same data in your customized report. - Select the fields you want to view in your report. The Data Tree on the left pane represents the fields of the monitored Tiers stored in the Performance Management Database. Each data field is mapped to an expression in the database, for example, Timestamp is mapped to a time of an event, and Program is mapped to a program name. From the Data Tree, select the required field and click the arrow near the Report Fields area. The field is added to the Report Fields area. Repeat this step as for every field you want to view.
- If you want to remove a field from the report, select the field and then click Remove.
- Click the up and down arrows to modify the order in which the fields will be displayed in the resulting SQL SELECT statement, and in the resulting Microsoft Excel spreadsheet.
- Use the Sort option to determine whether the rows will be displayed in ascending (A) or descending (D) order in the resulting Microsoft Excel spreadsheet. To sort, first select the box for the selected field. A check mark appears to show that this field was selected for sorting. Next click to set the order of the sort: ascending (A) or descending (D).
Setting filtering conditions
You can set filtering conditions to filter the data displayed in your customized report, through the Filter Table
The following figure shows how to set the filter conditions in your customized report.
Figure 1 Customized report data selection page - filtering conditions example
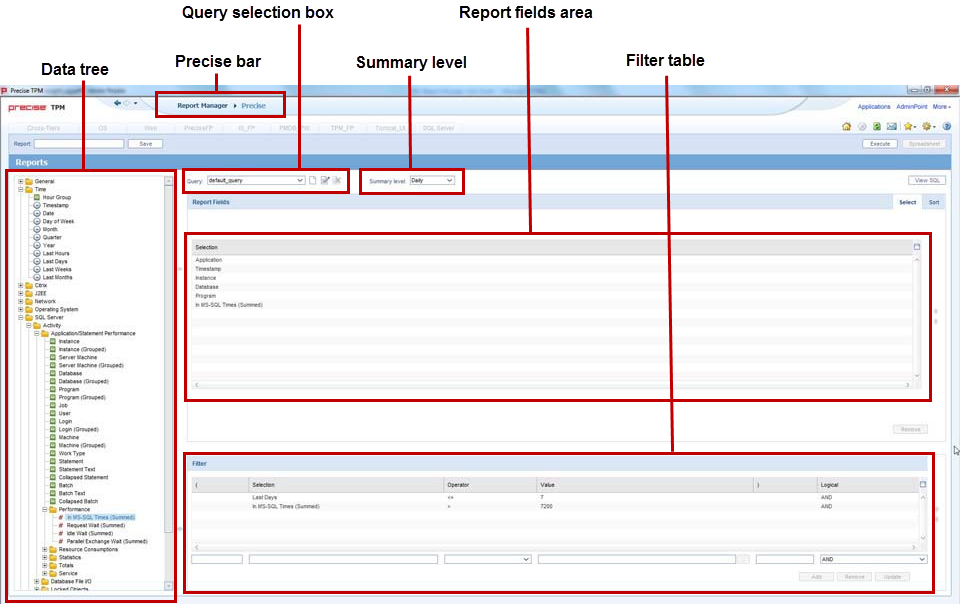
To set filtering conditions
- From the Data Tree, select the field for which you want to create the condition, and then click (arrow) of the Filter Table. The selected field appears in the Field Selection box.
- From the Operator box, select the required operator, such as Like, =, <, and In.
- In the Value box, do one of the following:
- Type a value by which the data of the field is filtered.
- Click the List icon and choose a data field from the List of Values dialog box.
- To remove a condition from the Selected Instances table, select it and then click Remove.
- To update a condition, select it from the Selected Instances Table, modify the condition parameters, and then click Update.
- To modify the order of the conditions, select the required condition from the Selected Instances Table and click UpArrow or DownArrow (located to the right of the Selected Instances Table).
Viewing and editing the SQL SELECT statement of a query
Report Manager creates an SQL SELECT statement for each query that you define. Actually, this statement is used to retrieve the required data from the Performance Management Database.
You can display the SQL SELECT statement of the query and modify it directly. This feature allows users who have experience with SQL to create complex queries.
After editing the SQL SELECT statement directly, no additional changes are allowed on the query through the Customized Report Data Selection page. For example, you cannot add new fields or remove existing ones from the query, because an SQL statement that is modified directly may include elements that collide with the Report Manager database mapping and SQL generation mechanism.
If you want to return to the original SQL statement to be able to update the query through the Customized Report Data Selection page, click Revert in the View SQL dialog box.
To view and edit the SQL SELECT statement of a query
- After completing the query definition in the Customized Report Data Selection page, click View SQL (located at the top right). The View SQL dialog box is displayed.
- To edit the SQL SELECT statement, click Edit and then modify the statement in the query text area.
- Click OK.
Running and designing a customized report
Report Manager generates the customized report using the query that you define in the Customized Report Data Selection page, and then displays the report in a Microsoft Excel file. The Microsoft Excel file consists of the following worksheets:
- One worksheet for each query that you have defined. These worksheets are protected so that no manual changes are allowed (Report Manager overrides these worksheets for each execution). The name of each worksheet is composed of the query name appended to the prefix FS-.
- A worksheet named report-design, in which you can design the customized report. That is, creating charts, tables or any additional elements that describe the data included in the protected worksheets. In addition, you can create new worksheets with additional elements. Report Manager does not override these worksheets in each execution.
Verify that you do not name the new worksheet with the FS- prefix, because then it will disappear the next time that the report is run or edited.
To run and design a customized report
- From the Customized Report Data Selection page, click Execute. Report Manager generates and then displays the report in a Microsoft Excel file. There are two worksheets in the Microsoft Excel file: the report design worksheet (labeled "report_design") and the protected worksheet (labeled by query name).
- In the Microsoft Excel file, select the report-design worksheet and design the customized report. When you complete the design, save the Microsoft Excel file.
- In Report Manager, in the Customized Report Data Selection page, type a name for your customized report in the Report name box, and then click Save (located at the top left).
Editing an existing customized report
Report Manager enables you to modify the queries of existing customized reports and to redesign the report-design worksheet of the Microsoft Excel file.
To edit an existing customized report
- From the Reports Table, select the customized report and then click Edit. The Customized Report Data Selection page opens including all the queries defined for the report.
- To redesign the customized report, click Spreadsheet (located at the top right). Report Manager opens the Microsoft Excel file of the last executed customized report.
- To modify the selected data, change the existing queries or add new ones as required, and then click Execute.
Report Manager executes the queries and then displays the report in a Microsoft Excel file. - In the Microsoft Excel file, select the report-design worksheet and redesign the customized report. When you complete the design, save the Microsoft Excel file.
- In Report Manager, in the Customized Report Data Selection page, click Save. Report Manager overrides the existing report.
Report Manager settings
Report Manager enables you to configure various settings through the Settings menu, located at the Precise bar.
Setting the General settings
The General Settings dialog enables you to set the following items:
- The subfolder in which Report Manager saves the PDF and Microsoft Excel files of executed reports. By default, the subfolder is not defined (Report Manager saves the PDF files in its server file system).
- An option that determines whether Report Manager generates links in the executed reports or not. These links enable users who read the reports to drill down from the reports to the exact location in the Precise or Insight products (depends on the selected entity location) for further investigation. By default, this option is enabled.
To set the General settings
- From the Precise bar, click Settings and from the menu select General Settings. The General Settings dialog box is displayed. Check the desired settings.
- To store PDF files in a specified subfolder in the Report Manager server, click the option box and type the path in the box, or open the Browse for Folder dialog box and then select the required subfolder.
- In the Generate Launching Links option box, select enable (to enable) or clear (to disable) the links.
Setting the Display settings
The Display Settings dialog box enables you to set the reports that will be listed in the Reports Table when you launch Report Manager. Any settings you make in this dialog box affect only your display and do not affect the reports list when other users launch Report Manager. However, a user with administrator privileges can set the reports list also for other users.
To set the Display settings
- From the Precise bar, click Settings and from the menu select Display Settings. The Display Settings dialog box is displayed. By default, all the pre-defined reports are selected.
- From the Tier box, select the Tier for which you want to modify the reports list.
- From the Listed to the User table, select the report that you do not want to display and then click Left Arrow.
Repeat this step for all Tiers as required.
Setting the Multi settings
When you launch Report Manager, the Multi Settings dialog box enables you to set parameters and scheduling times for multiple Report Manager reports. You can select one of the Tiers installed in your application, Cross-Tiers, or ALL (Tiers).
There are various sets of Report Manager reports. With the Multi Settings dialog box you can select one or all sets of Report Manager reports. The sets of Report Manager reports you can select are as follows:
- All (sets)
- Profile
- Exceptions
- Availability
- Load Balancing
- Capacity Planning
- Customized
To set the Multi settings
- From the Precise bar, click Settings and from the menu select Multi Settings. The Multi Settings dialog box is displayed.
- From the Tier box, select the Tier (or all Tiers) you want listed in the Multi Settings reports table.
- From the Set box, select the report set (or all sets) you want listed in the Multi Settings reports table.
- To change report parameters and/or scheduling, Press Ctrl+Shift to select a range of reports.
- Click Properties to set report properties. See Setting report properties.
- Click Schedule to set the time schedule for the reports. See Setting the schedule of a report generation.
- Click Close to close the Multi Settings dialog box.
Setting the Mail settings
The Mail Settings dialog box enables you to email Report Manager reports. The Mail Settings dialog box enables you to define the following:
- Enable/Disable the integration of Report Manager with an Email server.
- The name of the mail server.
- The name of the person the Report Manager messages are sent by.
To set the Mail settings
- From the Precise bar, click Settings and from the menu select Mail Settings. The Mail Settings dialog box is displayed.
- Select Integrate Report Manager with an Email server to enable the mail utility.
- Insert the Email server name and originator of the mail messages.