This section includes the following topics:
About the Precise TPM Applications screen
The Precise TPM user interface provides the high level view over all the applications defined at the framework. You can navigate between applications and review their topology and statistics.
In addition to the links to specific applications, the left side of the screen also includes links to transactions and alerts. It should be noted that these links change according to the selected application.
On the right side of the screen you can examine tier and instance tables. Additionally, you may analyze findings and drill down for more information.
The figure below shows an example of the Precise TPM Applications screen.
Figure 1 TPM Applications Screen
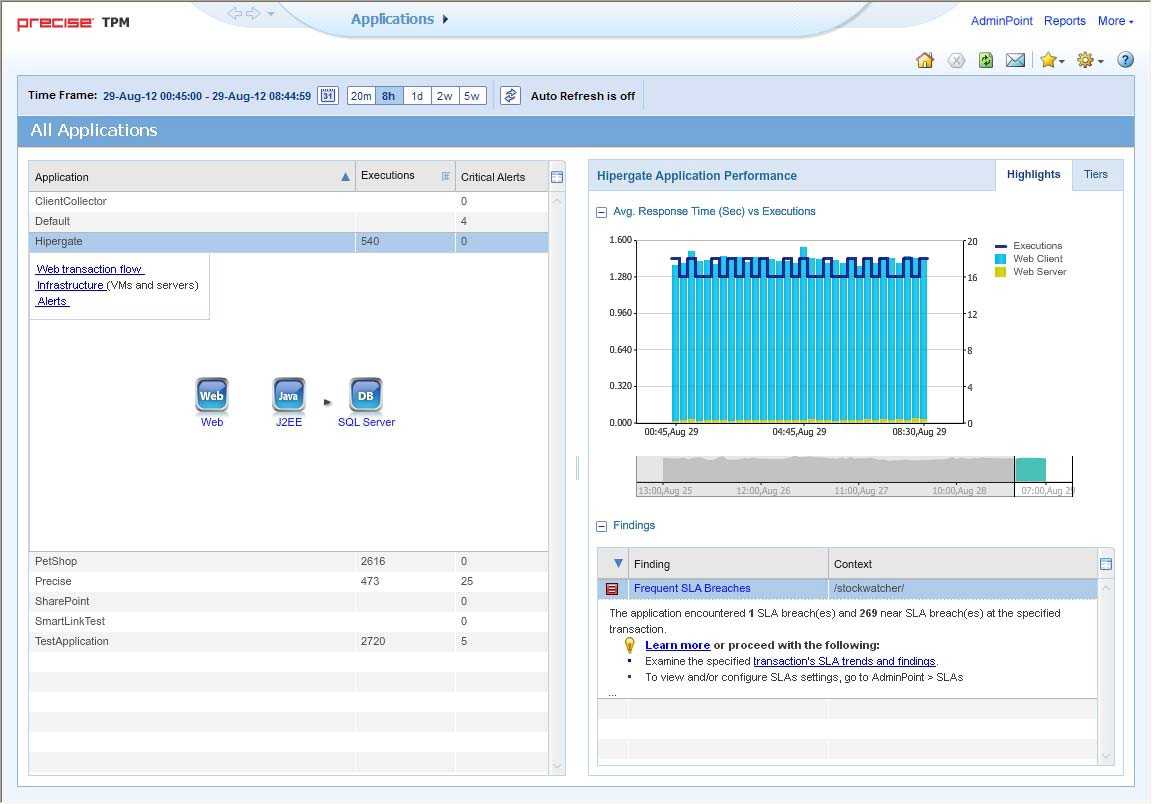
About the Findings area
For selected tabs in Precise products, the association area includes the Findings area, displaying problematic findings for the application. The findings feature is a high level tool, designed to provide the user with an overview of performance issues within the monitored application and enable quick and efficient navigation to the relevant tab for further analysis and handling. The displayed performance findings may indicate performance deterioration as well as incorrect methods usage. Each finding appears as a row in the displayed table of findings. Hover the mouse indicator over the single-line displayed finding to expand the finding. When expanded, the finding details area provides important guidelines as to what may be the root cause for the reported problem, and what the recommended steps are to resolve this problem.
The table below describes the information that is displayed in the Findings area.
Table 1 Information displayed in the Findings area
| Column | Description |
|---|---|
| Severity | The severity of the finding is calculated using a formula. The position of the finding in the list is determined by an internal scoring system that is based on the knowledge of Precise product experts. The severity is indicated by the following colors:
By default, findings are displayed according to severity. |
| Finding | A short name of the Finding. |
| Context | Entity/Method name (unless specified for the whole instance). The entity/method name is a short name but the long name is displayed in the ToolTip. Some of the findings are identified in specific Methods while others are relevant for the entire instance. In the latter case, a finding is specified as an instance-related finding. Rows are aggregated by finding and the URI/method/SQL name and not by ID. |
| Finding Overview | Displays specific details regarding the finding in context. This is displayed in the expanded view only. |
| Learn More (Advice) | Provides recommendations for solving the selected finding. For each finding, it lists all relevant pieces of advice and all applicable solutions. You should carefully review all data for the finding and then choose the advice that best suits your needs. This is displayed in the expanded view only. |
| Proceed with the Following (Bullets) | Provides expert knowledge about the selected finding. The information displayed will direct you if you have difficulties deciding which advice to take or which solution to implement. This is displayed in the expanded view only. |
Investigating a finding
Perform the following steps to investigate a finding.
To investigate a finding
- In the Time Frame list, select the period of time you want to analyze.
- In the All Applications table, select the application you want to investigate.
- In the Finding area, review the top Findings for the selected instance displayed in the Findings table. The findings displayed in this table are sorted by severity.
- In the Findings table, select the finding you want to analyze further.
- In the selected finding (the expanded view), read the data displayed for the finding and follow any links provided to view additional information (advice) or next steps (bullets) to resolve the problem.
For more information, refer to Examining Precise for TPM Findings.