This section includes the following topics:
About the Dashboard workspace
The Precise for Microsoft .NET Dashboard workspace provides a comprehensive overview of the health and status of all instrumented application server instances, based on the data collected according to the application instrumentation. The information displayed in this workspace pinpoints performance trends and issues in your application and offers clear navigational recommendations throughout Precise for Microsoft .NET for further analysis and handling.
See “About Precise for Microsoft .NET tabs” on page 9, “About the Activity workspace analysis tabs” on page 23, and “About the Statistics workspace” on page 33.
How the Dashboard workspace is structured
Figure 1 Precise for Microsoft .NET Dashboard workspace
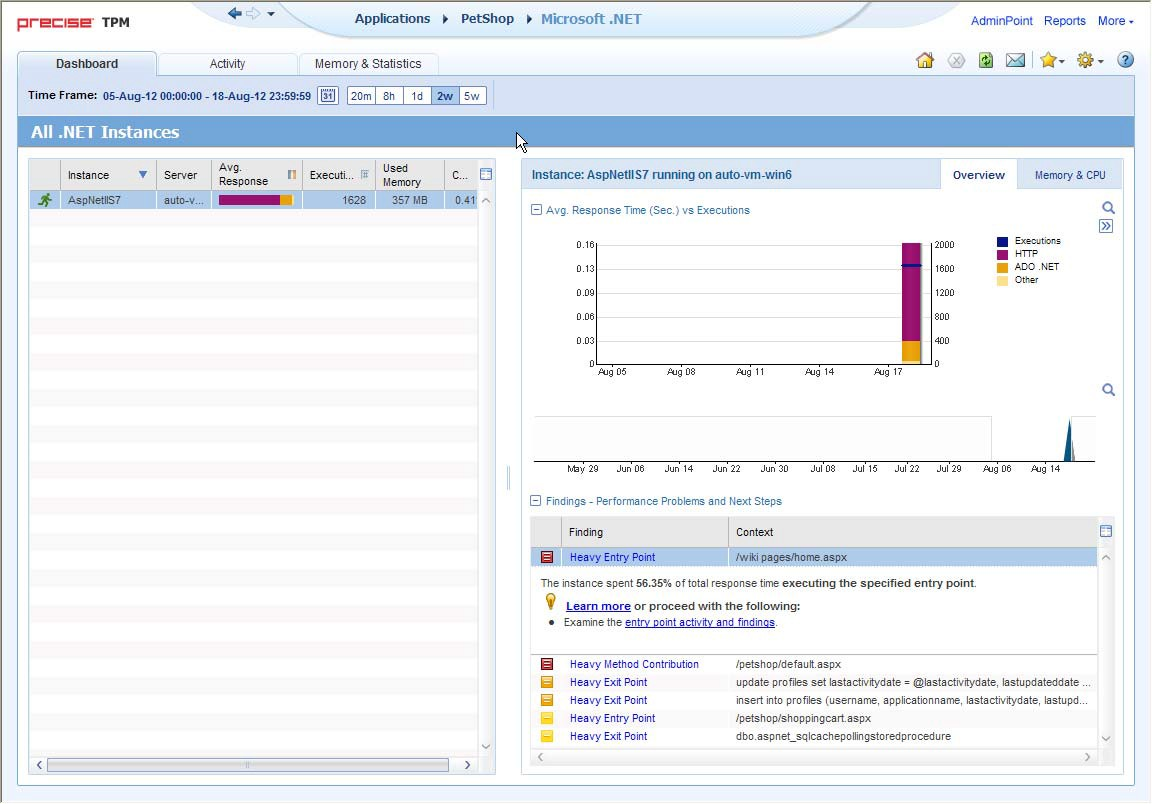
The Dashboard workspace is divided into two areas, the Main area and the Instance Details area. The Main area lists all the instances that are monitored by Precise for Microsoft .NET. The Instance Details area provides comparative information regarding the selected instance.
About the Main area in the Dashboard workspace
The instance table displayed in the Main area lists all the instances that are monitored by Precise for Microsoft .NET Tier. Each row corresponds to an instance. The All .Net Instances list summarizes the activities of all the instances.
The table below describes the information that is displayed on the different instances in the application.
Table 1 Instance table
| Column | Description |
|---|---|
| Status Icon | Indicates one of three possible instance availability states:
|
| Instance | Name of the instance. |
| Avg. Response | Average time it took to service a service request for a specific instance. |
| Executions | Total number of executions during the selected time frame. |
| Used Memory | Average amount of memory used by all the executions of the instance during the selected time frame. |
| CPU | Average percentage of CPU time used by all the executions of the instance during the selected time frame. |
About the Association area in the Dashboard workspace
The Association area in the Dashboard workspace contains two tabs, providing a performance trends overview and resource consumption information for the selected instance.
The following tabs appear in the Dashboard workspace:
The overtime graphs display instance or entity statistics for the selected time frame. Depending on the number of points displayed in the graph you may want to zoom in or out. For more information, see “Focusing on information in overtime graphs” on page 14.
About the Overview tab
The Overview tab displays overtime graphs and a findings table, providing the user with an overview of the performance of all instances, or a selected instance, in the selected time frame.
The information displayed in the Overview tab includes:
- Avg. Response Time (Sec) vs Invocations. An overtime graph displaying a breakdown, by type, of the average response time for the instance, relative to the number of invocations.
- Overtime trends. An overtime graph displaying the performance trends for the instance. The performance trends for the instance in the selected time frame are shown in color, and the performance trends for the instance in the previous and (if applicable) following time frame are shown in grayscale. This view provides the user with a greater overtime perspective of the instance’s performance patterns and behavior.
- Findings table. A table listing the findings detected in the selected time frame, displayed in order of severity. For more information, see “About the Findings area” on page 11.
About the Memory & CPU tab
The Resources tab displays overtime graphs, providing the user with an overview of the selected instance’s resource consumption in the selected time frame.
The information displayed in the Memory & CPU tab includes:
- Used Memory (Avg). An overtime graph displaying the breakdown of the used memory.
- CPU Consumption. An overtime graph displayed the CPU consumption rate.