This section includes the following topics:
- About Precise for Oracle
- Components of Precise for Oracle
- How Precise for Oracle works
- What you can do with Precise for Oracle
- Where to get more information
About Precise for Oracle
Precise for Oracle lets you manage the performance of your applications. It provides you with the tools necessary for proactive monitoring, diagnosing, detecting, and correcting of performance problems before they become visible in your Oracle databases and related applications.
Precise for Oracle addresses the needs of Database Administrators (DBAs), system administrators, managers, quality assurance specialists, and planners. It thereby provides a complete view of application performance by capturing, measuring, and correlating performance metrics from all critical system components.
Precise for Oracle offers a wide range of data presentations to enable quick and accurate monitoring and performance analysis. Current operational data is displayed to enable easy identification of problematic conditions. Recent operational data, for designated time periods, supplements operational data to enable operations staff to detect problematic conditions that occurred in the past and that are likely to occur again and again, if not corrected.
Performance data is archived and a fully detailed display of the historical data is provided for use in performance, QA, and capacity planning analysis.
Additionally if the DBA sees that a business transaction is performing badly, he can focus the tuning efforts on it. Precise for Oracle will give specific findings and recommendations to help him improve the transaction statement performance and the business as a whole. To that end, Precise for Oracle now has a possibility to show application and transaction context as part of the tuning efforts.
Improved performance management
IT staff frequently search for answers to questions like “Why did the application run so slowly last night?” or “Where is the application spending its time?”
Precise for Oracle can help IT staff find the answer to these questions. The first step is to establish a baseline level of database resource consumption by understanding the behavior of the average application. The behavior of the average application represents the average percentage of the total time that all applications spend consuming or waiting for each resource. These aggregate figures provide a broad picture of the operation of your database. They enable you to identify major bottlenecks in your system, for example CPU and I/O limitations, Oracle database waits due to locks, remote queries, and so on.
Precise for Oracle also lets you focus on and drill down to individual applications, SQL statements, and database objects in your system that are responsible for heavy consumption of system and database resources and to quickly find the definitive root cause of performance degradation.
In a multi-tiered application, you can extend the reach of Precise for Oracle by installing Precise for Database & Storage, which drills down into the storage layer behind the database Tier and the optional Interpoint extensions to see into the Tier in front of the database.
Integration with other Precise products
Precise for Oracle is fully integrated with other Precise products. You can receive alerts using Alerts, examine Oracle reports within Report Manager, and view Oracle data in Insight and the Precise Custom Portal. You can launch Precise for Oracle from Insight, Alerts, Report Manager, Precise for SAP, and Precise for J2EE. For more information on the individual components, see the user's guide of the relevant product.
Alerts provides a notification system that alerts you to application response time problems and other fault conditions, and lets you launch Precise for Oracle in context to view more detailed data.
Report Manager gathers and organizes historical information that enables the IT team to focus on infrastructure hot-spots. You can use Report Manager to compare period-to-period performance against a baseline and identify response time problems “at-a-glance,” before they affect your users. It queries the PMDB and displays the results in reports that are generated on a scheduled basis or on demand.
If you are following the Precise tuning methodology, both Alerts and Report Manager enhance your ability to detect performance problems by answering the question “Do I have a performance problem?”
The Precise Custom Portal, is a lightweight, configurable portal application that provides access to various types of data from different applications. The Precise Custom Portal features a Web-based view. It is highly customizable and extensible, allowing you to build a dashboard for each user or each function within your organization. For example, you can build a dashboard for all the information that a system administrator or director of IT operations would need to constantly follow up on. This component is automatically installed as part of the Precise framework installation.
Insight gives you an end-to-end view of your applications performance, across all your Tiers. It helps you find the source of performance problems in multi-tier applications by allowing you to compare the resource consumption of each Tier. In this way, you can answer the question “Where is my performance problem?” If Insight shows that the problem lies within Oracle, you can use Precise for Oracle to drill down further.
Components of Precise for Oracle
To understand the Precise for Oracle architecture, it is important to know the overall architecture of the Precise product suite. For more information, see the Precise Installation Guide.
Precise for Oracle employs client/server architecture to provide comprehensive 24 x 7 performance monitoring, vital for both short and long-term monitoring of your Oracle database.
The following figure illustrates the typical architecture of Precise for Oracle.
Figure 1 Precise for Oracle architecture
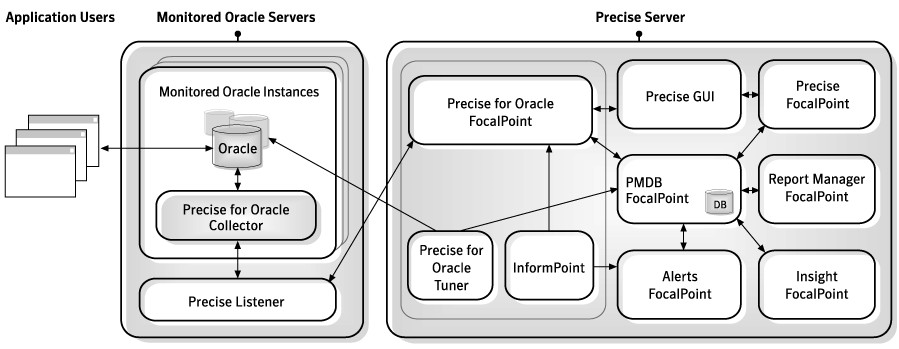
On the monitored server, Precise for Oracle consists of the following components:
- Precise Listener
- Precise for Oracle Collector
- Optional Collector extensions for Storage and ERP applications (not shown)
On the Precise server, Precise for Oracle consists of the following components:
- Precise FocalPoint
- Precise for Oracle FocalPoint
- Precise for Oracle Tuner
- PMDB FocalPoint
- Precise user interface including Precise for Oracle
Other Precise components can integrate with Precise for Oracle. These components can also be present on the Precise server:
- Report Manager FocalPoint
- Alerts FocalPoint
- Alerts InformPoint
- Insight FocalPoint
See the Precise Installation Guide and the Precise Administration Guide.
Precise Listener
There is one Precise Listener per physical server or domain for each installation of Precise. Its purpose is to handle communication with other Precise components, using TCP/IP. It listens on port 20702 by default. The Precise Listener handles all requests from the user interface and Precise for Oracle FocalPoint; no requests go directly to the Precise for Oracle Collector. If necessary, the Precise Listener runs a Data Retriever process to carry out the work.
Precise for Oracle Collector
There is one Precise for Oracle Collector per monitored Oracle instance. The Collector runs in the background, monitoring and recording all Oracle database activity on a 24 x 7 basis. It works using a sampling technique and thereby consumes fewer resources than a trace agent. The collected information is stored locally in historical files, which are subsequently transferred and loaded into the PMDB.
Optional Collector extensions
Optional Collector extensions are available. They provide additional information in certain applications, namely for storage and for Enterprise Resource Planning (ERP). Precise for Database & Storage correlates Oracle database activity with the I/O on the back-end storage. ERP extensions correlate Oracle database activity with front-end ERP users and transactions.
Precise for Database & Storage is available for the following technologies:
- EMC Symmetrix and CLARiiON
- HP XP Array
If storage system support is installed, the Collector provides detailed information regarding the I/O resource consumption across the storage devices. By investigating this information, you can relate I/O activity to specific components of the storage device and pinpoint the cause of the I/O performance degradation.
Within Precise for Database & Storage, it is possible to browse device-specific mappings and statistics information. For more information, see the Precise Installation Guide.
ERP extensions (also known as Interpoints) are available for the following technologies:
- Oracle Applications
- SAP
- PeopleSoft
- Siebel
If ERP support is installed, the Collector provides detailed information on the activities and resource consumption of packaged application entities. Heavy users of Oracle resources, such as: ERP users, transactions, and reports can be identified. You can also drill down to the statements executed by them and the objects they accessed.
Precise FocalPoint
There is a single instance of the Precise FocalPoint for each installation of Precise. Precise FocalPoint is the management software for Precise. It manages and communicates with other FocalPoints, such as Precise for Oracle FocalPoint, PMDB FocalPoint, and the Precise Listener on monitored servers. Precise FocalPoint also contains the HTTP server used for the user interface.
Precise for Oracle FocalPoint
There is a single instance of the Precise for Oracle FocalPoint for each installation of Precise. It performs the following major tasks:
- It is responsible for replying to user interface requests. Depending on the nature of the request, it will retrieve data from the PMDB or from the Collector using the Precise Listener or run a Tuner process to query the Oracle database itself.
- It periodically loads Collector data into the PMDB. According to the schedule defined in the PMDB, Precise for Oracle FocalPoint executes the Precise Listener on each monitored server to copy across the prepared historical activity files. They are then loaded into the PMDB.
- It periodically loads Oracle statistics, explain-plan data, schema changes, and database definition changes.
According to the schedule defined in the PMDB, Precise for Oracle FocalPoint runs a Tuner process to communicate with each monitored Oracle instance. - When Alerts is installed, it provides Alerts with Oracle-related metrics.
Precise for Oracle Tuner
The Tuner process is only created when certain information from the monitored database is requested and lasts for the duration of the request. For example, if you want to view the explain plan of a SQL statement and see the definitions and statistics for the database objects involved, the Tuner is executed on the server to retrieve the relevant information from the Oracle Data Dictionary.
PMDB FocalPoint
There is a single instance of the PMDB for each installation of Precise. It maintains the Oracle PMDB, in which most of the performance information is held.
Precise user interface including Precise for Oracle
Precise provides a Web-based graphical user interface (GUI). Client requests are sent to Precise FocalPoint using HTTP. The Precise GUI is accessed through a browser. After you log in as an authorized user, the Precise StartPoint page opens. From the StartPoint, you can access the Precise for Oracle user interface and all other Precise products.
How Precise for Oracle works
Precise for Oracle stores a complete history of your database activity in the PMDB. This provides you -with a performance tracking tool that gives you the ability to assess database performance trends and analysis changes in database activities over long periods of time. This data is vital for identifying patterns in resource consumption and predicting future resource consumption in your Oracle database.
The Precise for Oracle Collector runs on your server using a unique, accurate and comprehensive sampling technology that requires low overhead. It collects performance data from an instance and then correlates and loads the data into the PMDB tables. This data is then analyzed and summarized by the FocalPoint. You can later access this data using the Precise for Oracle Web browser interface.
This interface lets you submit queries in a flexible intuitive manner, and then displays responses to your queries in a format that easily permits you to detect performance problems, drill down to the source of these problems, and subsequently tune your applications and database. The user interface is divided into a number of tabs to enable quick, accurate, and focused monitoring and performance analysis.
See “About Precise for Oracle tabs” on page 21.
The interface and tabs support the Precise tuning model of Detect, Find, Focus, Improve, and Verify. The following example shows how you might follow the tuning model in some of the tabs:
- The Dashboard tab, with its at-a-glance view of all Oracle instances side-by-side, lets you detect which is the most problematic instance. You can drill down, in context, to find and focus on the problem in the Current, Activity, or Statistics tabs. Automatic findings will guide you to the problems which, in turn, will take you to the next step of the problem solving action.
The Dashboard tab also lets you compare performance and statistics among your Oracle instances. - The Current tab gives a near real-time picture of activity in your instance and lets you easily find problematic conditions that are occurring now.
- The Activity tab lets you find and focus on the top resource consumers within your application over time. It also lets you identify patterns in resource consumption and predict future resource consumption in your Oracle database, such as:
- When comparing business cycles
- When comparing software releases
- In capacity planning or trend analysis
- The Statistics tab lets you focus on instance-wide statistics that affect all applications.
- Having identified a performance problem, you can either improve the performance of your application, or use one of the automated tuning tools in Precise for Oracle, such as:
- The SQL tab, where ‘Alternative SQL’ suggests more efficient SQL, and Advice recommends index changes.
- The What-If tab, where you can simulate the effect of any proposed index change without physically creating the index.
- After implementing a performance improvement, return to the Activity tab and check if the change created the desired effect on your application or database. For example, return to the Activity tab to see if resource consumption was reduced.
What you can do with Precise for Oracle
Use Precise for Oracle to detect, diagnose, and resolve performance problems in your Oracle database. Precise for Oracle lets you identify real-time performance problems (for example locking problems) and monitor a complete history of your Oracle database.
Where to get more information
More information on Precise, its products, technical notes, and so on, can be found in the Release Notes document for this version.