The Alerts view provides comprehensive information on availability and performance issues in your SQL BI environment, as well as OS statistics on SQL BI services instances. In the Alerts tab, you can get an overview of all active alerts, as well as an overview of historical alerts.
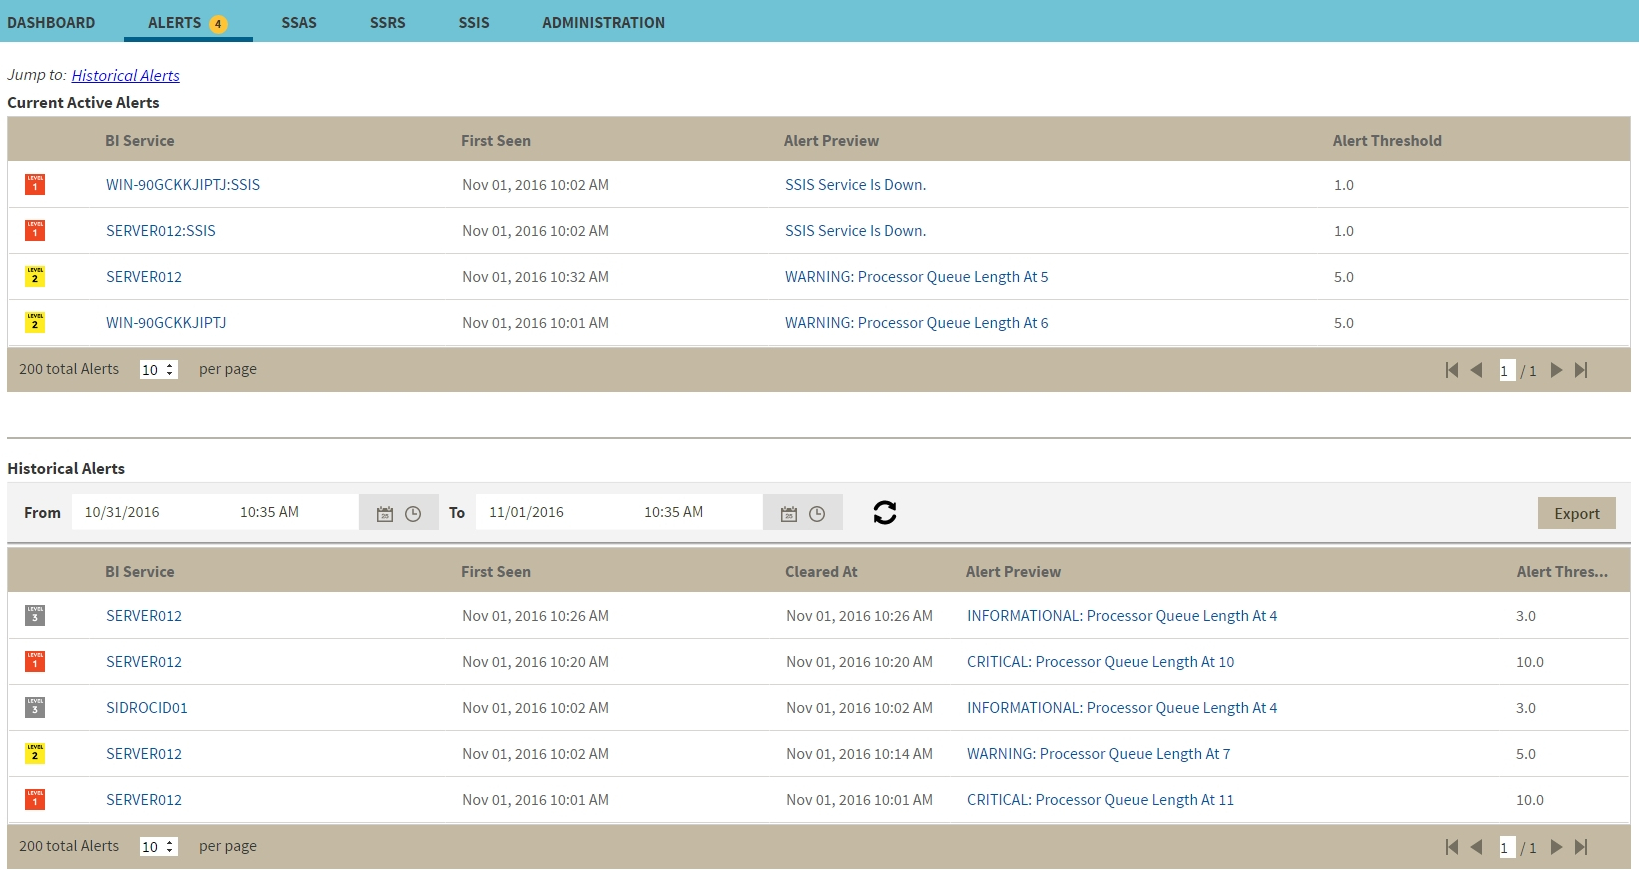
Current Active Alerts
The current performance alerts roll-up view displays detailed information such as:
- BI Service
- Date/Time of alert inception
- Alert Preview (description)
- Alert Threshold
Click the BI Service name from the list to access an overview of the selected BI Service. You can also click the Alert Preview text description on any Alert to view detailed information or display the chart for the specific metric.
The most recent alert always shows up at the top of the panel.
The following colors in the Alerts view are associated with a status and action within SQL BI Manager:
Color | Meaning |
|---|---|
Gray | Informational threshold where SQL BI Manager generates an informational alert. |
Yellow | Warning threshold where SQL BI Manager generates a warning alert. |
Red | Critical threshold where SQL BI Manager generates a critical alert. |
From the current performance alerts you can jump to your historical alerts. Find the Jump to Historical alerts option above the Current Active Alerts list.
Historical alerts
The historical alerts roll-up view displays detailed information such as:
- BI Service
- Date/Time of alert inception
- Date/Time of alert clearing
- Alert Preview (description)
- Alert Threshold
Additionally, you can:
- Specify a time frame to display historical alerts.
- Click the BI Service name from the list to access an overview of the selected BI Service.
- Click the Alert Preview text description on any Alert to view detailed information or display the chart for a specific metric.
SQL BI Manager allows you to configure alert thresholds, see Configuring alert thresholds for more information.