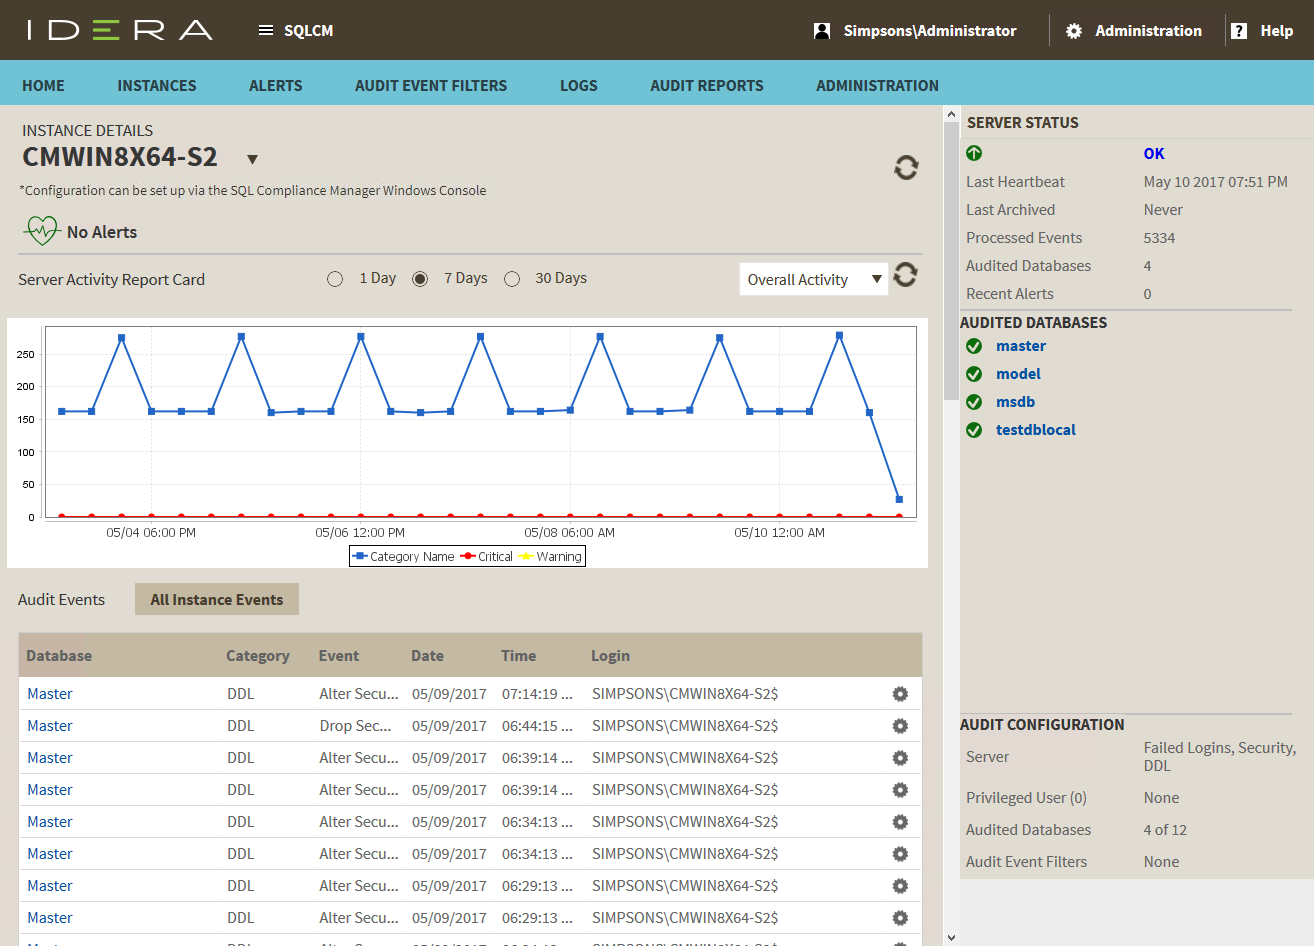
After you register an instance in IDERA SQL Compliance Manager, you can access the Instance Details view by clicking an instance name.
The Instance Details view allows you to view a list of audit events occurring on the databases for that instance, information about its databases, bar graphs, other relevant information, and also get access to audit configuration details.
The instance Details view provides a high-level status of the audited events and the activity occurring in the selected instance.
Alerts
On this SQL Compliance Manager shows you the active alerts for the selected instance, grouped by alert type, and ordered by level of criticality, where:
- Level 4 = Severe
- Level 3 = Critical
- Level 2 = Warning
- Level 1 = Informational
If you have no active alerts, you will see the message: No alerts.
Server Activity Report Card
The Server Activity Report Card allows you to review the status of the selected instance and the recent activity on it for up to 30 days. Use Server Activity Report Cards to identify problems that might require more in-depth analysis based on:
- Overall Activity.
- Event Alerts.
- Failed Logins.
- Security
- DDL
- Privileged User.
Audit Events
All audited events for the selected instance appear in the Audited Events section of the Instance Details page. This table includes:
- Database Name
- Event
- Date
- Time
- Login
Users can also view the Event Properties by clicking the gear icon and selecting the Event Properties option.
Server Status
On the right side of the Instance Details page, users can check the Server Status. This section displays.
Audited Databases
Displays the number of databases currently audited. These databases are hosted by SQL Server instances that are registered with SQL Compliance Manager. This number does not include databases where auditing is not yet configured or is disabled.
Audit Configuration
Displays the audit configurations set for the selected instance.
