MY VIEWS allows you to group servers to provide a high-level, global view of multiple monitored servers. This view includes basic statistics about your registered SQL Server instances and quick links to more detailed information. A monitor displays statistics for each SQL Server instance included in the group.
Access My Views
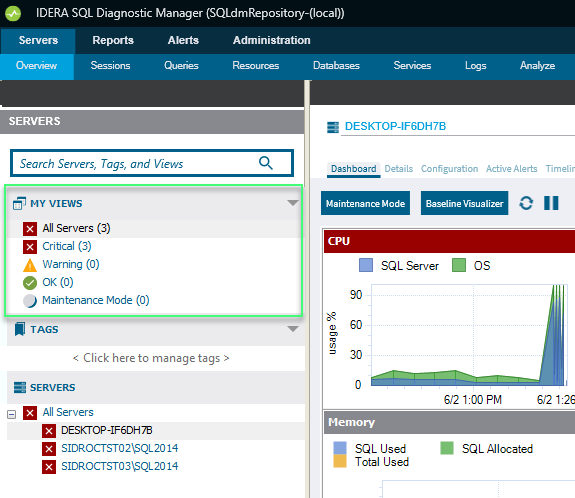
MY VIEWS is available at all times as part of the navigation pane as shown in the following image:
Use the group list
SQL Diagnostic Manager updates the data shown in the thumbnail view of the group list according to the interval entered in the Status and Alerts Refresh field on the Console Options window, accessed by selecting ![]() > Console Options. This information is collected from the last data point stored in the SQLDM Repository.
> Console Options. This information is collected from the last data point stored in the SQLDM Repository.
By default, the group list displays basic statistics for each of the SQL Server instances monitored by SQL Diagnostic Manager. This information includes the following statistics for each instance:
Response Time
Refers to the time it takes for a query to go from the SQLDM Console to the SQL Server instance and back.
User Sessions
Refers to the total number of SQL Server user sessions.
SQL CPU Usage
Refers to the average percentage of SQL Server processor usage on the computer hosting the SQL Server instance.
SQL Memory Usage/Allocated
Refers to the amount of memory in use by the monitored SQL Server instance.
SQL Disk I/O
Refers to the number of physical reads and physical writes made by the SQL Server instance between refreshes. If you see a high percentage of physical reads , you can improve performance by allocating more memory to the SQL data cache.