The SERVERS sidebar contains all the SQL Server instances that are monitored by SQL Diagnostic Manager, providing a general overview.
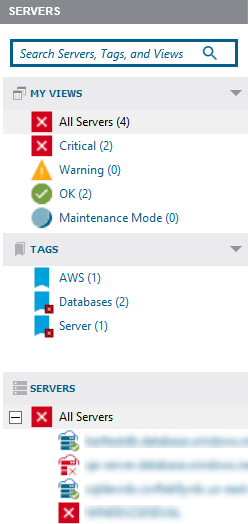
- The SERVERS panel includes a search bar that eases the search in environments with a large number of instances.
- Under MY VIEWS, select All Servers to see all your instances' thumbnails with fast information, and review more about the available views. Additionally, MY VIEWS displays status icons, when a SQL Server instance is associated with a Critical, Warning, OK, and Maintenance Mode metric icon, you can use your mouse cursor to hover over the server name to view the top three associated alerts, allowing you to prioritize your SQL Server instances and the work that you need to perform.
- The Servers sidebar displays tags, which are a way of labeling and organizing servers.
- Under Servers, you can find the list of the monitored servers by SQL Diagnostic Manager, click any of your servers' names to access the Overview screen of the selected server.
The Servers sidebar can be expanded or collapsed, allowing you to have a larger screen space.
Additionally, SQL Diagnostic Manager allows you to undock and move your panels as you prefer. Double-click the dark gray bar to undock the panel, move it wherever you prefer, and double-click to return to its original location:

Refresh your alerts
A full refresh of alerts excluding table fragmentation occurs in the following circumstances even if longer collection intervals are defined:
- When the collection service starts
- When the collection service receives a new workload, such as redirecting the Management Service to a new Repository
- When you add a SQL Server for collection
- When a SQL Server resumes from Maintenance Mode
- When a user selects Refresh Alerts
This refresh does not cause the collection of non-alertable data, nor cause the collection of anything that is disabled.
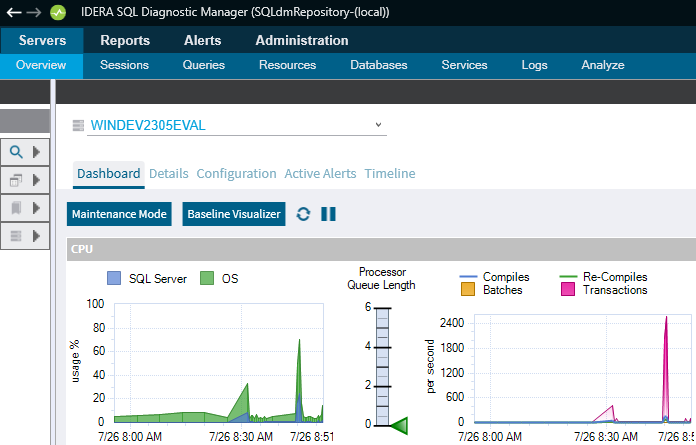
Overview tab features
When you select a SQL Server instance in the Servers sidebar, the Overview tab displays the following options:
Dashboard
The Dashboard view is where you can see a graphical representation of the most important metrics for the selected SQL Server instance.
Details
The Details view lets you view the values of each data item collected and create charts with the specific data items you need.
Configuration
The Configuration view allows you to view and control the operational configuration of the monitored SQL Server instance.
Active Alerts
The Active Alerts view allows you to view and control the active alerts as of the most recent data collection.
Timeline
The Timeline view allows you to view all alerts and maintenance mode events as well as the first monitored event for the selected SQL Server instance.
Other Servers features
By right-clicking a SQL Server instance in the Servers sidebar you can perform the following actions:
Open
Opens the Dashboard view for the selected monitored SQL Server instance.
Refresh Alerts
Gathers the alert status and refreshes the tree view information for the selected monitored SQL Server instance.
Delete
Allows you to delete the SQL Server instance from your SQL Diagnostic Manager installation. When you select Delete, SQL Diagnostic Manager displays a message asking whether you want to retain the collected data for the SQL Server instance, and it also allows you to cancel out of the deletion process.
You cannot retrieve collected data once it is deleted from the SQL Diagnostic Manager Repository. Use the Delete option with care.
Maintenance Mode
Allows you to take an individually monitored SQL Server instance offline for scheduled maintenance or other reasons.
Configure Baseline
Allows you to configure the performance baseline for the selected SQL Server instance.
Apply Alert Template
Allows you to select an existing alert template to apply to the selected SQL Server instance.
Configure Alerts
Allows you to specify the alert criteria for each collected metric on the selected SQL Server instance.
Snooze Alerts
Allows you to snooze all the alerts for the selected SQL Server instance instead of selecting the snooze feature for each alert individually.
Resume Alerts
Allows you to resume any alerts set to snooze on the selected SQL Server instance.
Properties
Allows you to view and edit the collection properties of your SQL Server instance.