Virtual environments, such as those provided by Hyper-V or VMware, allow you to run multiple instances of computers or "virtual machines" on a single, physical host server. These VMs create a virtual environment that enables IT shops to more fully utilize the hardware they already have, allowing administrators to maintain fewer physical servers which then consume less power, take up less real estate, and generate less heat.
While there are many advantages to using a virtual environment, there are some disadvantages. One is that a virtual machine currently is not as fast or efficient as a standalone physical machine. Administrators must closely monitor and manage their virtual environments because over-utilized hardware can quickly and severely impact the performance of their servers, which are constantly waiting for physical resources to become available to process their workloads.
SQL Diagnostic Manager includes VM monitoring to allow administrators to get a glimpse of what is going on inside the virtual environment in which their SQL Servers are running, to make sure that their VMs and their host machines are running at peak efficiency. This topic is a general outline of how SQL Diagnostic Manager works in a virtual environment and includes links to other areas where you can find additional VM-specific information.
Using the hypervisor to manage resources
On the physical server hosting a virtual environment, there is a process called the hypervisor or virtualization manager running in the background. The hypervisor manages the interactions between the virtual machines and the physical hardware, manages resources, and then distributes the physical resources as required by each of the VMs it is hosting.
An administrator can intentionally over commit resources on a physical host with the idea that it is unlikely that all of the VMs need to utilize all of the resources on the host at the same time. The hypervisor is also affected by this shift, and manages any occasion when all of the active VMs need more physical resources than is available from the host. Note that there are ramifications for the extra processing that is occurring when the hypervisor is taxed. This additional processing is the overhead for a virtual environment and consumes CPU, memory, and network resources.
How SQL Diagnostic Manager collects and presents metrics involving a virtual environment
The guest operating system on a VM operates no differently than it does when running on a physical machine with full access to all of the resources at its disposal. But the machine hosting the VM operates differently because of the virtual environment. The physical resources of the host are shared with the other VMs on the host. Due to the additional overhead of virtualization, and the hypervisor managing contention for resources, the metrics that the guest OS reads as utilization of its resources are not entirely accurate as they do not take into account that virtualization overhead, nor does it measure that it is waiting on physical resources to process its workload.
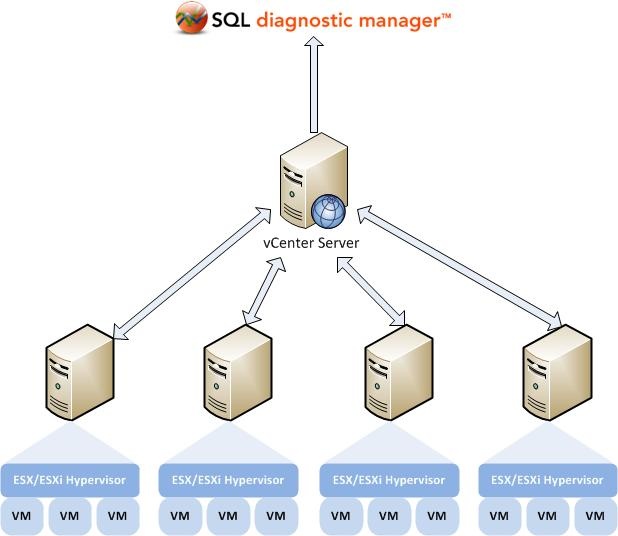
The image below shows a typical virtualized environment with VMware. In this environment, the ESX/ESXi hypervisor on each individual host server collects the performance statistics and reports the data back to a central vCenter Server. SQL Diagnostic Manager then collects that information from the vCenter Server in order to show those statistics along with the other SQL related performance information.
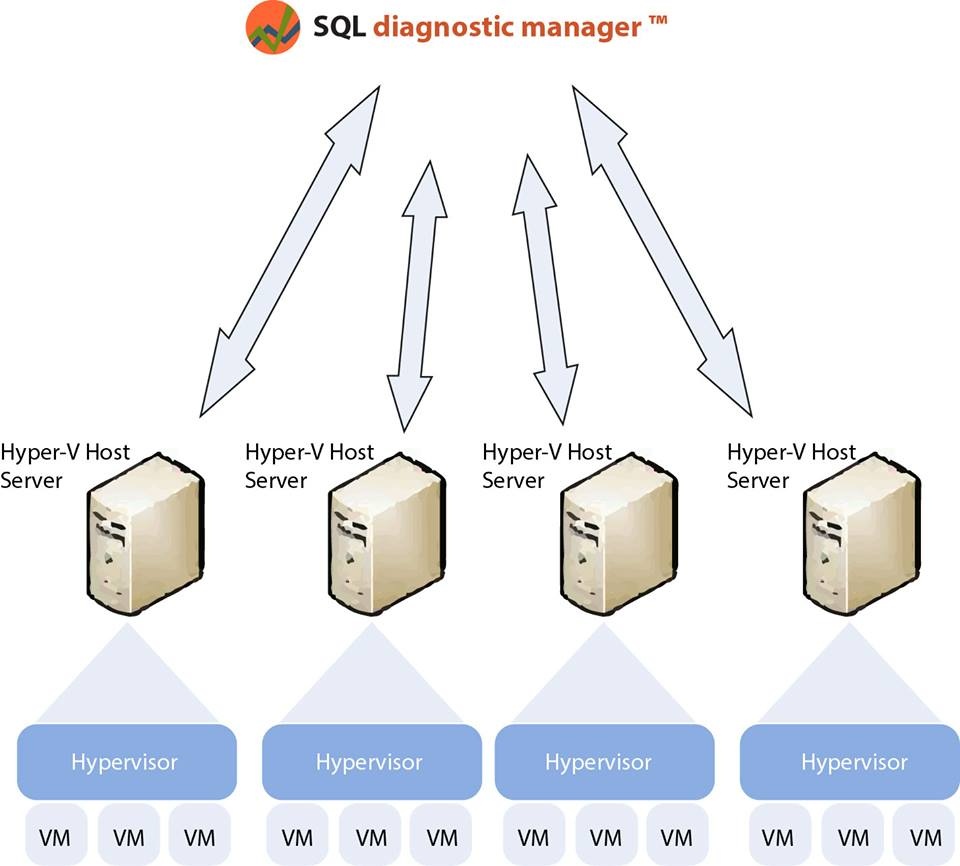
In virtualized environment with Hyper-V, the process of how SQL Diagnostic Manager collects and presents metrics is slightly different from that of a VMware setup. In this environment, SQL Diagnostic Manager collects all the required performance statistics from the Hyper-V host server and virtual machines using the WMI interface. See Hyper-V user requirements for information on how to successfully collect host and VM metrics.
SQL Diagnostic Manager displays virtual machine and host metrics as collected from the perspective of the physical host. In other words, these are the “true” physical metrics. Whereas, the metrics that SQL Diagnostic Manager displays for the OS on a virtualized machine are what Microsoft Windows calculates as using without regard to any overhead. For example, SQL Diagnostic Manager displays the OS CPU Usage at 35%, but metric displayed for the VM CPU Usage is 38%. This discrepancy results from the additional overhead within the hypervisor used to run the VM, and the VM is charged for the additional processing.
Link a monitored virtual SQL Server instance to the vCenter Server or Hyper-V host server
To link a monitored virtual SQL Server instance to the host server that manages your VMs, click Tools > VM Configuration to access the VM Configuration window. SQL Diagnostic Manager displays the current relationships between your available virtualization host servers and your monitored SQL Server instances. For more information about linking a monitored virtual SQL Server instance to a vCenter Server or Hyper-V host server, see Configure your virtual machine connections.
VM data collection
The VM collector connects to your virtualization host server (vCenter Server or Hyper-V host server) during the scheduled refresh for each of your monitored virtual SQL Server instances. If the SQL Diagnostic Manager Management Console is open to the Overview Dashboard or any Resources view for a specific instance, data is also collected based on the Server View Refresh setting in the Console Options page. In this situation, it is possible that the collector connects to the virtualization host server and virtual machines every few seconds.
You can adjust the scheduled refresh rate for a monitored virtual SQL Server instance by right-clicking the instance name, and then selecting Properties.
Differences in statistics
You may notice some difference in your statistics, such as SQL Diagnostic Manager displaying a higher OS CPU usage than your VM CPU usage. While the hypervisor manages resources efficiently, it is possible that the demand for physical resources is greater than what is available. For example, a guest OS on a virtual machine submits a batch of work to a CPU. However, all of the physical CPUs are committed to other work, so there is no physical CPU available on the host to process the work. In this situation, the VM waits for a CPU to become available to process its work. While it is waiting, the guest OS is unaware of the wait and assumes that it is simply taking longer for the CPU to process this batch of work, and the OS thinks it is using more CPU power than it is actually using.
Remember that SQL Diagnostic Manager uses the additional overhead of the hypervisor to calculate the VM metrics. In this situation, the hypervisor knows the VM is just waiting for a CPU, so it does not charge the VM for CPU processing power while it is waiting. The result is that the guest OS reports that it is using the additional processing power, however the hypervisor simply reports what is actually used. In this situation, your CPU usage metrics that are reported by Windows are higher than what is reported by VMware or Hyper-V for that VM.
Available metrics related to your VMs
A monitored virtual SQL Server instance appears in the Servers pane in the same way as a monitored physical SQL Server instances. Click the appropriate virtual instance, and SQL Diagnostic Manager displays the same dashboard panels as for a monitored physical SQL Server instance, but also include specific metrics for the VM and host server.
The following dashboard panels include VM- or host-related information:
- CPU panel - Includes VM and Host usage metrics. The information available in this panel comes from the Server Details and Resources Summary views.
- Memory panel - Includes the VM Memory Usage and Host Memory Usage charts. The information available in this panel comes from the Server Details and Resources Summary views.
- Network panel - Includes the VM Network Usage Throughput and Host Network Usage Throughput charts. The information available in this panel comes from the Server Details and Resources Summary views.
- VM Disk Usage panel - Includes the amount of data read from and written to disk for this VM during the sample interval. The information available in this panel comes from the Resources Disk view.
- Host Disk Usage panel - Includes the amount of data read from and written to disk for this host server during the sample interval. The information available in this panel comes from the Resources Disk view.
- Virtualization panel - Includes the Virtual Memory Usage and Virtual Disk Usage charts plus the CPU Ready Wait Time gauge. The information available in this panel comes from the Server Details view.
Use the available virtualization alerts and VM-related reports to get the most information regarding your monitored virtual SQL Server instances and host servers.
Available VM-related reports
Available virtualization alerts
- Host CPU Usage Alert
- Host Memory Swap Detected alert
- Host Memory Usage Alert
- Host Power State Alert
- VM CPU Ready Wait Time Alert
- VM CPU Usage Alert
- VM Host Server Change Alert
- VM Memory Swap Delay Detected Alert
- VM Memory Usage Alert
- VM Power State Alert
- VM Reclaimed Ballooned Memory Alert
- VM Resource Configuration Change Alert
- VM Resource Limits Detected Alert
SQL Diagnostic Manager identifies and resolves SQL Server performance problems before they happen. Learn more > >