SQL Diagnostic Manager, by default, displays a wide variety of the most common SQL Server and Operating System performance metrics. In addition to providing these common metrics, custom counters provide the ability to add additional performance metrics to the SQL Diagnostic Manager Console used for historical trending, on-demand monitoring, and schedule refresh alerting.
Import or export a custom counter
In the IDERA community site you can share or import custom counters created by other SQL Diagnostic Manager users.
You can find a list of operating system counters by searching for "Windows Performance Counters" on technet.microsoft.com.
You can add the following types of metrics:
- All Windows System Counters, including all Perfmon and WMI counters
- Any SQL Server System Counter stored in the sysperfinfo system table
- Any numerical value you would like to return from a custom SQL script
- VM and host server performance counters accessible through the host Server
In addition to providing all of the above counters, you can add any additional counters contained in a new Windows or SQL Server Service Pack. This allows you the flexibility to monitor any metric that is important to your enterprise.
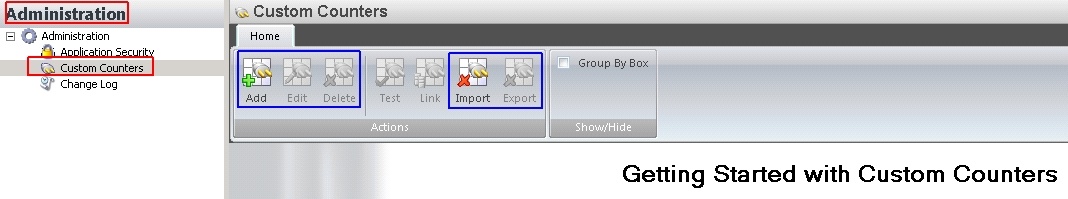
Access the Custom Counters view
To open the Custom Counters view, click Administration > Custom Counters from the navigation pane.
Create a custom counter
To add a custom counter:
- Select Administration in the navigation pane.
- Select Custom Counters.
- If this is your first time to access this page, click Click here to add a new custom counter now. If you have accessed this page before, click Add.
- Click Next on the Add Custom Counter wizard Welcome page.
- Select a counter type, and then click Next.
- Select the counter you want to monitor, and then click Next.
- Select the counter calculation type and scale factor, and then click Next.
- Type a name for the custom counter, select a Category, add a Description, and then click Next.
- Configure your alert settings related to the new custom counter, and then click Next.
- Click Finish.
Using custom SQL scripts
Use custom SQL scripts to monitor metrics that are not connected to system or SQL counters, under-utilized SQL 2005 DMVs, or metrics that are very specific to your environment, such as row count for a production table.
SQL Diagnostic Manager does not scrub custom SQL batches for SQL Injection protection. Use caution when entering custom SQL scripts as it is an advanced feature. The go command is not a Transact-SQL statement and you cannot use this command in custom SQL batches. The go command is a batch separator for Management Studio, Query Analyzer, sqlcmb, and osql.
Locate your custom counters
Custom counters appear in the following places in the SQL Diagnostic Manager Console:
Alert Configuration window
Your new custom counters appear in the Alert Configuration and the Default Alert Configuration windows in the Custom category. You can edit the alert thresholds, and even decide whether you want an alert associated with the new counter.
Server Details view
The Server Details view lists all the metrics monitored by SQL Diagnostic Manager, including all your new custom counters. You can filter this view to display only your custom counters by selecting the Custom Counters radio-button in the Filter ribbon. You can access this window by selecting details on the Server view or by double-clicking Custom Counters in the Servers tree.
Custom Counters table
SQL Diagnostic Manager provides a list of all your custom counters in the Custom Counters table on the Administration window. In addition to viewing a list of custom counters, you can add a new counter, edit a counter, delete a counter, test a counter, or link a counter to a SQL Server instance for monitoring.