The web console's main dashboard is comprised of three main sub-views:
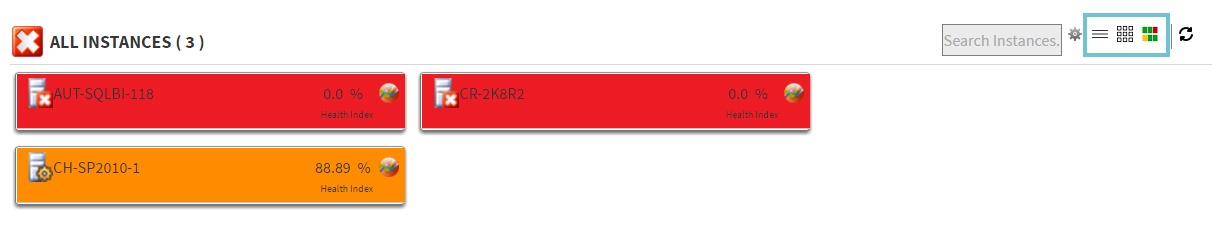
These sub-views display all data collected at the last refresh for all your monitored SQL Server instances. To access any sub-view, click the appropriate button in the upper-right corner of the dashboard as shown in the following image:
List sub-view
The list sub-view offers a means to quickly identify the status of instances, as well as the possibility to navigate to the single instance dashboard when clicking on a specific row.
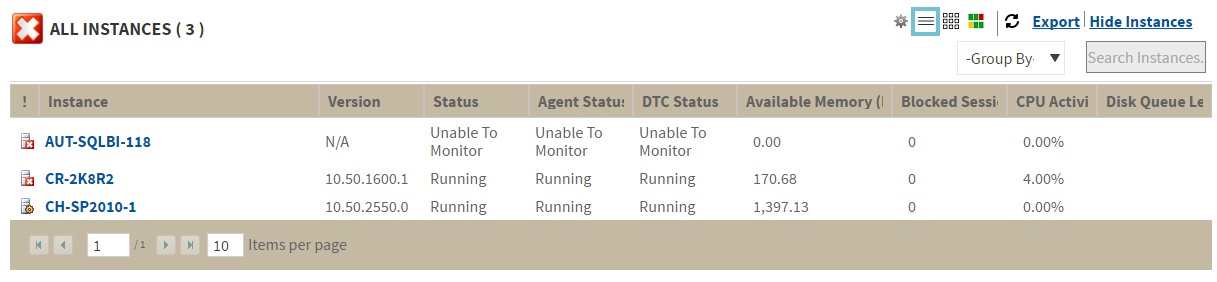
The list sub-view provides you with the following SQL Server information:
Instance Name
Displays the name of the monitored SQL Server instance.
SQL Server Version
Displays the edition and version of SQL Server software used in this instance.
SQL Server Status
Displays the status of the SQL Server service such as running, stopped, and paused.
SQL Agent Status
Displays the status of the SQL Server Agent service such as running or stopped.
DTC Status
Displays the status of the Distributed Transaction Coordinator service such as running or stopped.
Available Memory (MB)
Indicates how much available memory is allocated for SQL Server.
Blocked Sessions
Displays blocked process sessions information on the SQL Server instance.
CPU Activity
Displays the percentage of CPU consumed by your SQL Server, virtual machine, and host server.
Disk Queue Length
Displays the average number of system requests that are waiting for disk access on the computer hosting the SQL Server instance
Actions
Sort
Instances on the list sub-view are sorted by severity. To re-organize information, click a column header or select the option to group by severity or tags (Group By).
Export
You can export instance information in PDF, XLS, or XML by clicking EXPORT at the top of the list sub-view.
Show/Hide instances
You can hide/show instances information by clicking HIDE INSTANCES at the top of the list sub-view.
Thumbnail sub-view
The thumbnail sub-view is the default view in the SQL Diagnostic Manager web console's dashboard and provides you with a graphical replication of your monitored SQL servers. Access additional details in the single instance dashboard by clicking on a thumbnail’s instance name or easily spot categories that have active alerts as marked by a critical icon. Navigate to an instance’s specific category view in case it has active alerts by clicking on the marked category icon. You can also launch the SQL Diagnostic Manager console directly from the thumbnail sub-view by clicking the SQL Diagnostic Manager icon  .
.
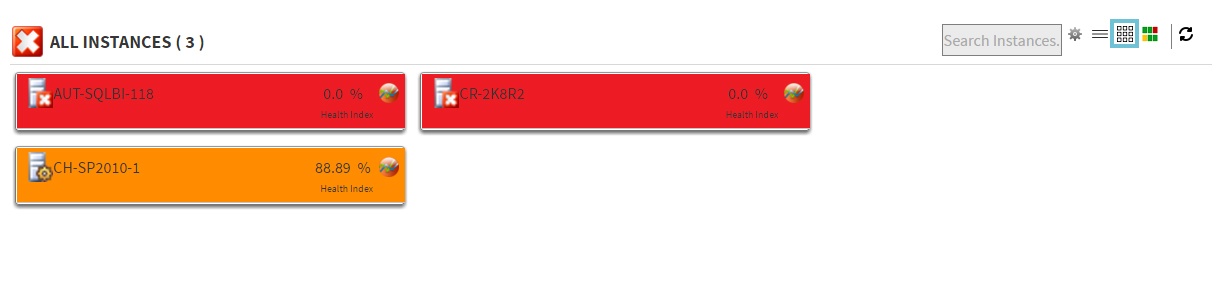
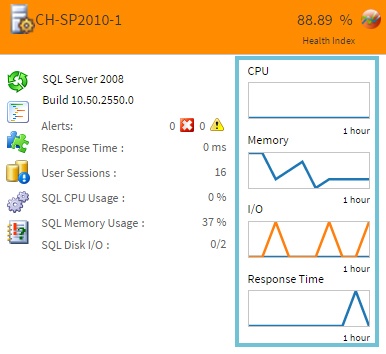
The thumbnail sub-view displays basic statistics about your SQL Servers:
SQL Server version
Displays the edition and version of SQL Server software used in this instance.
Response Time
Refers to the time it takes for a query to go from the SQL Diagnostic Manager Console to the SQL Server instance and back.
User Sessions
Refers to the total number of SQL Server user sessions.
SQL CPU Usage
Refers to average percentage of SQL Server processor usage on the computer hosting the SQL Server instance.
SQL Memory Usage
Refers to amount of memory in use by the monitored SQL Server instance.
SQL Disk I/O
Refers to the number of physical reads and physical writes made by the SQL Server instance between refreshes.
In addition, the thumbnail sub-view includes CPU, Memory, I/O, and Response Time sparkline graphs for a 1 hour-view so that users can obtain an overview of key metrics quickly.
Category icons and actions
In the thumbnail sub-view, use your mouse cursor to hover on a category icon in the left of the thumbnail. If the category icon contains active alerts, you can click it to access the Alerts Detail screen.
![]()
If there are no active alerts, you can click a category icon and you are directed to a specific category view in the single instance dashboard. The table below shows the relationship between the category icons and their corresponding views:
| Icon | Category |
|---|---|
 | Sessions tab of the single instance dashboard |
 | Queries tab of the single instance dashboard |
 | Resources tab of the single instance dashboard |
 | Databases tab of the single instance dashboard |
 | Alerts Detail screen |
| Overview tab of the single instance dashboard |
Instances in thumbnail sub-view display according to severity. This means that critical instances show up on the top of the dashboard.
Heatmap sub-view
The heatmap sub-view provides you with a visual overall status of your SQL Server environment in the form of a grid of color coded squares that contain a health index. Through its color scheme and health index you can easily identify which of your monitored instances need the most attention. Each square in the heatmap sub-view represents a monitored instance. From each square, you can access basic statistics but also drill down for details.
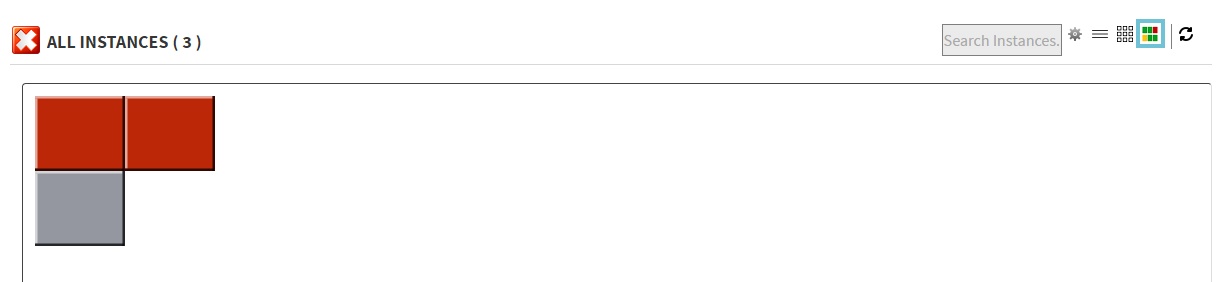
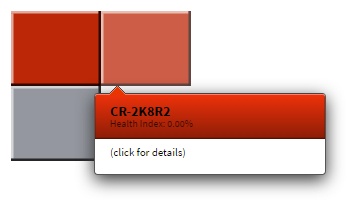
To glance at instance health information just hover over a specific square to see its health index.
Upon clicking a specific square, the health index displays performance line charts for CPU, Memory, IO, and Response Time from the past hour.
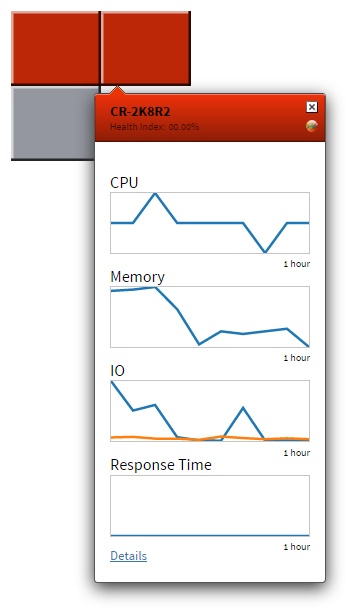
Additionally, you can:
- Click Details to access the Overview tab of the single instance dashboard.
- Launch the SQL Diagnostic Manager console by clicking the SQL Diagnostic Manager icon .
How to interpret the health index in the heatmap sub-view?
The health index is a percentage value that provides an estimate of the relative health of your monitored SQL Server. The health index is based on the following raw calculation:
| Health Index Raw Calculation = Instance or Tag Scale Factor * (# Critical Alerts * Critical Scale Factor + # Warning Alerts * Warning Scale Factor + # Informational Alerts * Informational Scale Factor) |
The raw score is normalized to a range between 100% and 0%. SQL Server is healthier the closer its health index is to 100%, and it is in critical state the closer its health index is to 0%. Use the severity factors to change the relative weight in the calculation. Use tag and instance factors to assign instances more or less importance in the overall heatmap ranking.
To configure the Health Index Calculations:
- Click the gear icon
 at the upper-right corner of the All Instances section to display the Heatmap Calculation Configuration dialog.
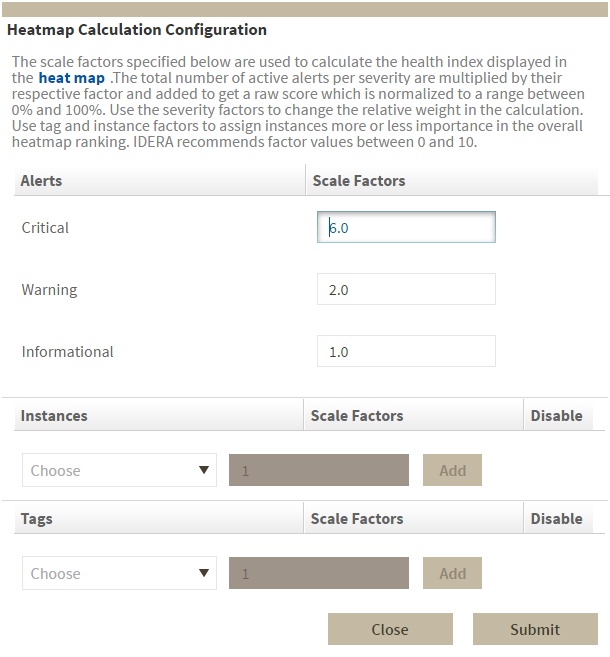
- Type the values that you want in the respective Alert Scale Factor field. IDERA recommends factor values between zero and ten.
- Choose an instance from the registered instances and click Add to apply a distinctive scale factor.
- Choose a tag from the available tags and click Add to apply a distinctive scale factor.
- Click Submit.
The heatmap sub-view displays instances according to severity. The color of the square relates to the percentage of its health status and includes a range of colors not only restricted to green, yellow, and red.