The Active Alerts panel provides you with updated information on all the active alerts in your SQL Server environment. The panel allows you to see if more than one alert is active at the time of receiving an alert notification, making it easier to determine the underlying problem.
This panel shows time of alert inception, alert description (summary), instance name, alert category, and show details.
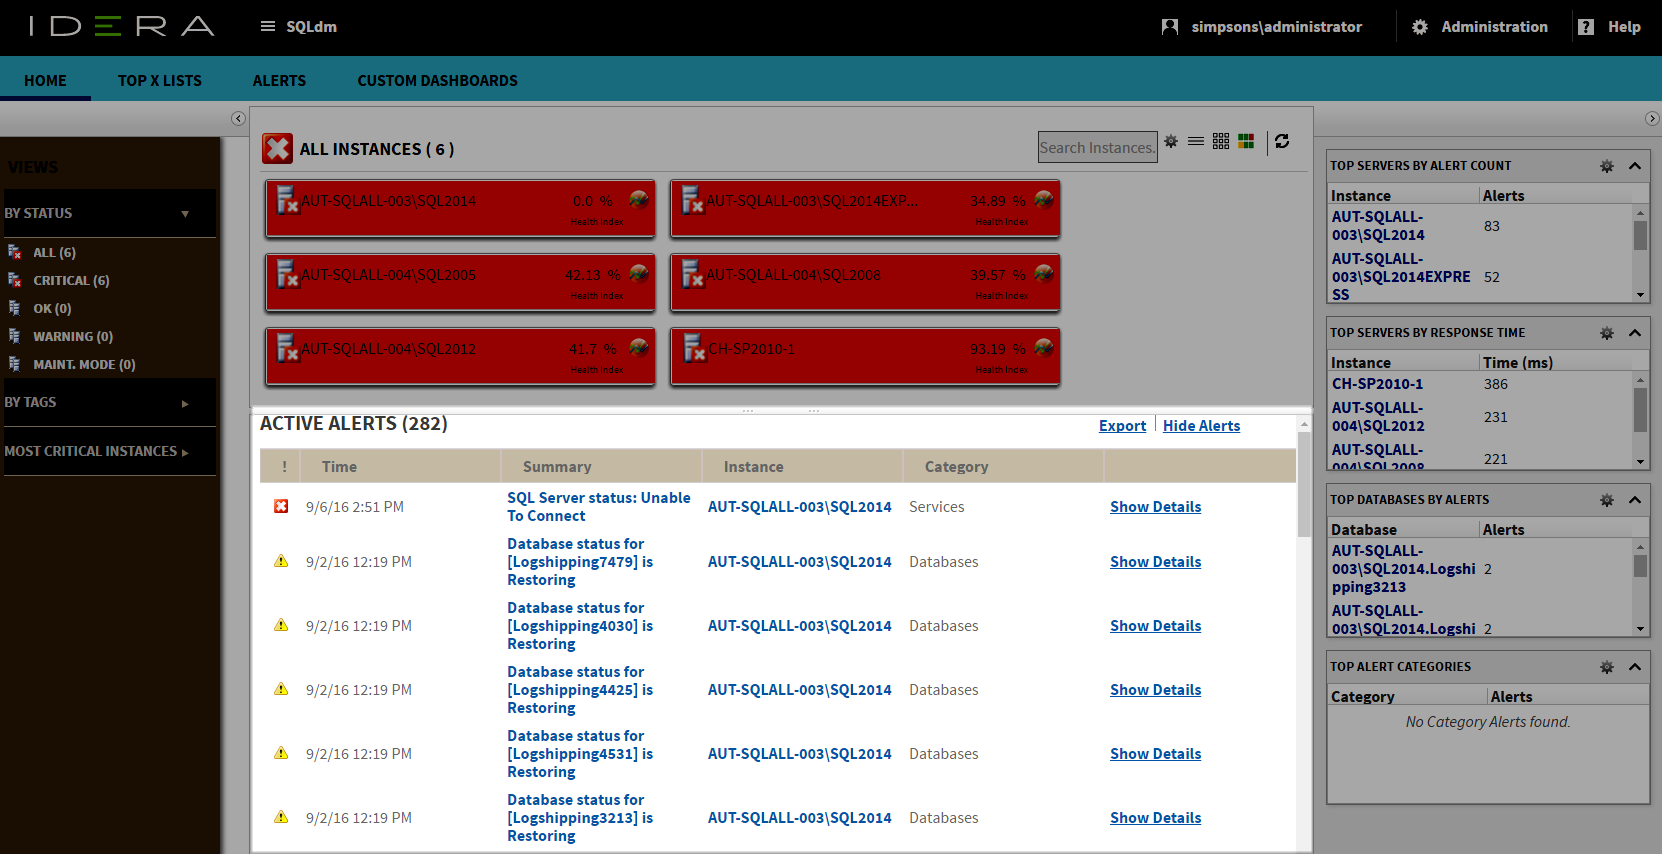
In the Active Alerts panel it is possible to take two actions to obtain further information, click any of the linked instances and the single instance dashboard displays or click Show Details and Alert Detail screen displays.
Columns are sortable, just click the column header of your choice.