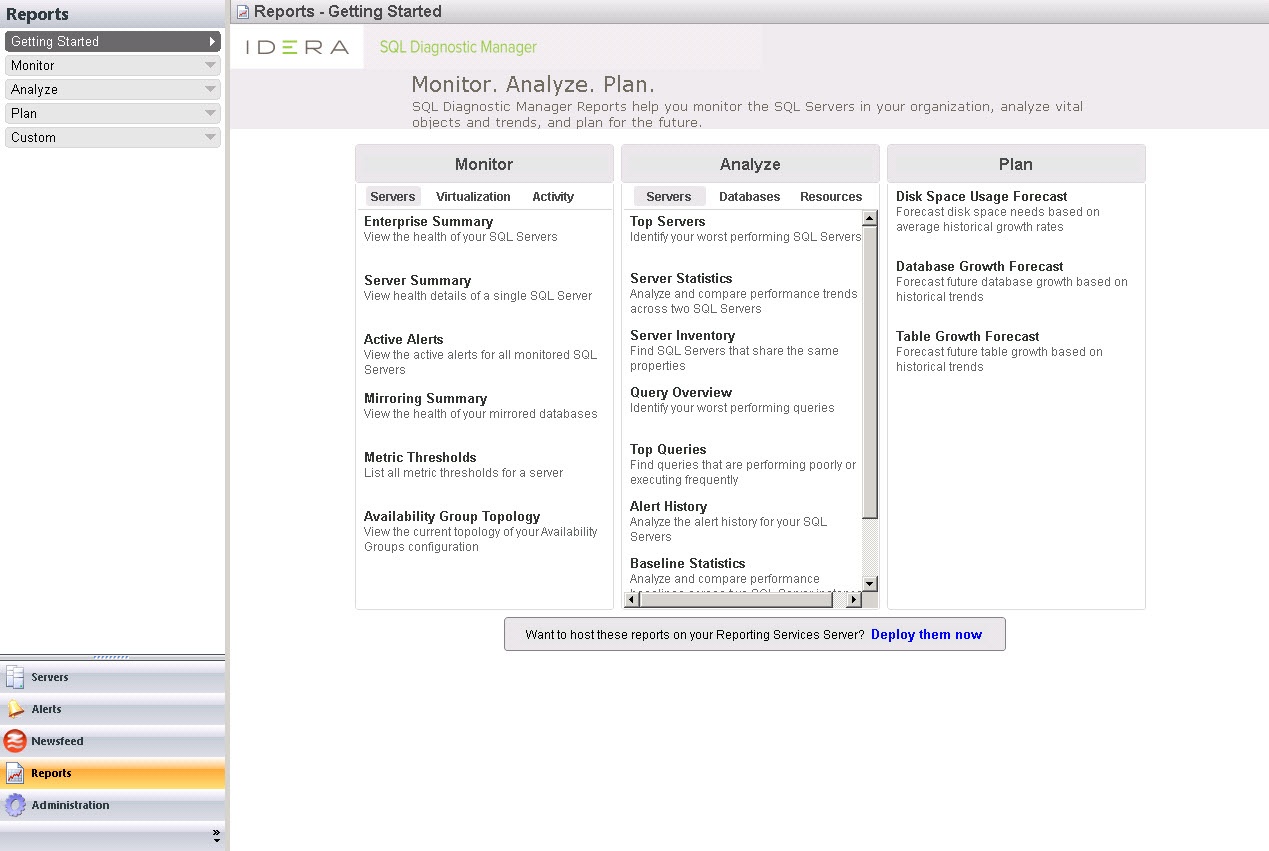
The Reports view lets you to create reports that allow you to analyze current and historical performance and statistical data. SQL Diagnostic Manager provides three types of comprehensive reports: Monitor, Analyze, and Plan along with the ability to create custom reports.
Reports look best when printed in letter-size format.
Access the Reports view
SQL Diagnostic Manager provides two paths to access the Reports view. The first access path is by clicking Reports in the Navigation pane. The second access path is by clicking Go > Reports. The second path is the only option if you hide your Navigation pane in the SQL Diagnostic Manager Console.
Customize reports
After you run a report, you can use the Report Toolbar to select the page setup, page width, and print layout to customize your report.
Click Show Filters to open the Filter area of the Reports view. Each report has several filter options, such as which SQL Server instances to display, the period of time to report on, and the time intervals to show in the charts.
Deploy reports to Microsoft Reporting Server
You can use the SQLDM Reports Deployment wizard to deploy specified reports to the Microsoft Reporting Server.