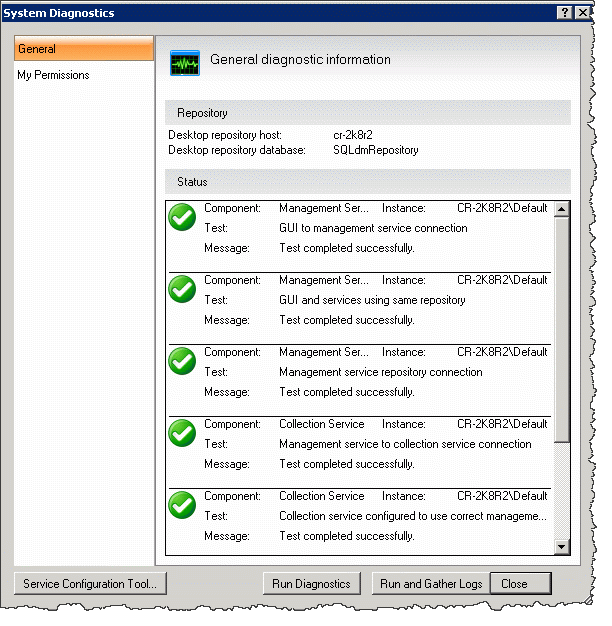
The System Diagnostics window allows you to test the connections between the SQL Diagnostic Manager services and other SQL Diagnostic Manager components, as well as collect service and desktop client logs. This connection test is designed to assist you when the location of SQL Diagnostic Manager components changes due to a migration.
You can perform the following tests using system diagnostics:
Management Service Tests
- GUI to management service connection
- GUI and SQL Diagnostic Manager services using the same repository
- Management service repository connection
Collection Service Tests
- Management service to collection service connection
- Connection service configured to use correct management service
- Collection service can connect to management service
- Collection service heartbeat status
One-click System Diagnostics button:
You can run system diagnostics plus collect service and desktop client logs by clicking on the Run and Gather Logs button. This feature also saves the status of each collected log in a text file.
In a SQL Diagnostic Manager distributed environment, the Run and Gather Logs command, gathers only local logs. To collect all product logs, run this option from the machine where your SQL Diagnostic Manager services are installed.
Access the System Diagnostics window:
To open the System Diagnostics window, select Help > System diagnostics from the Toolbar menu.
In a console-only installation the Service Configuration Tool button is not available since the SQLdm Management Service Configuration Wizard is installed in the machine where all the SQL Diagnostic Manager services reside.
