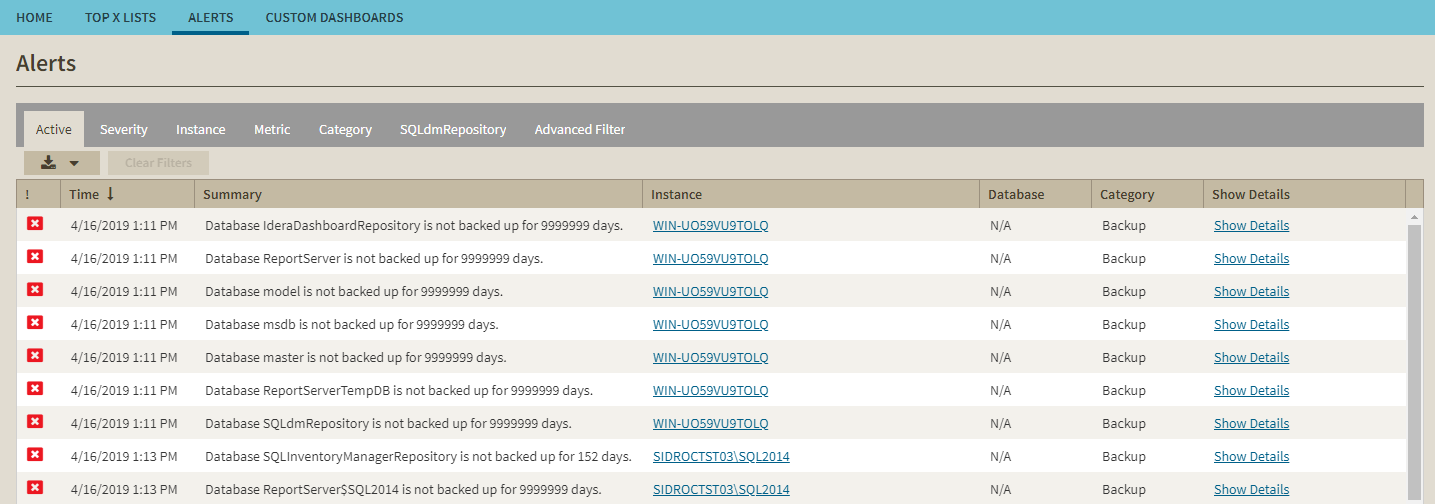
SQL Diagnostic Manager includes an improved Dashboard. The Alerts tab of the SQL Diagnostic Manager web console allows you to view all alerts for all the servers in your environment.
Organize your alerts
Your alerts are organized under the following columns:
- Active - Organizes all your alerts that are currently active.
- Severity - Organizes all your alerts by their severity (Severity 8, Severity 4, and Severity 1).
- Instance - Organizes all your alerts by monitored SQL Server instance.
- Metric - Organizes all your alerts by each of the metrics affected.
- Category - Organizes all your alerts by their category.
- SQLdmRepository - Organizes all your alerts by SQL Diagnostic Manager Repository.
- Set your advanced filter in IDERA Dashboard
Severity
In the new Alert grid, Severity uses the following numerical values:
- Severity 8 = Critical
- Severity 4 = Warning
- Severity 1 = Informational
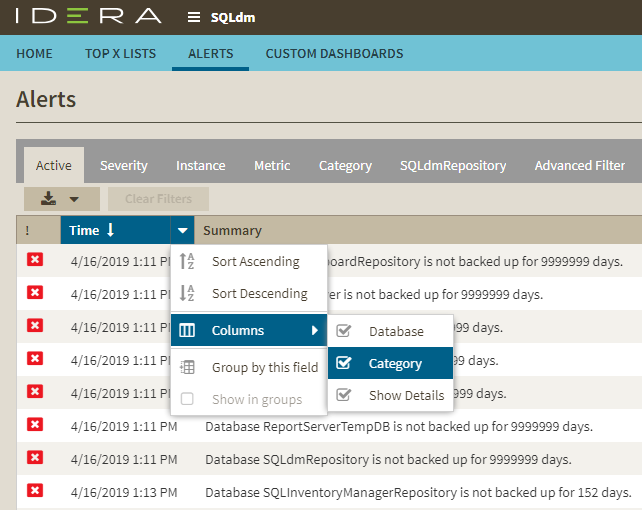
The Dashboard console has a new alert grid and custom filters that help you organize your alerts in your most convenient way. Click the icon located next to the column name to expand the drop-down menu. This menu allows you to sort your criteria by Sort Ascending or Sort Descending, you can remove or add the Database, Category, and Show Details columns, and group the information by fields.
Additional options
- Access the single instance dashboard by clicking the instance name in an alert row.
- Access the Alerts Detail screen by clicking Show Details.
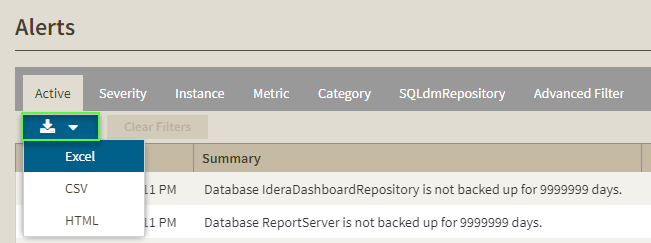
- Export your alerts information in different formats: Excel, CSV, and HTML.


