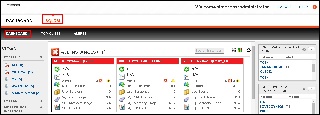
The SQLdm web console interface boasts an easy-to-navigate dashboard comprised of several views, sub-views, tabs, and widgets that provide a complete synopsis of your SQLdm environment. Click the image to view full size.
|
On the dashboard you can find the following sections:
- Views by Status, Tags, or Critical Instances
- List, thumbnail and heatmap sub-views
- Active alerts roll up view
- Top servers by alert count and response time widgets
- Top databases by alerts
- Top alert categories
- Top X Lists tab
- Alerts tab
Additional options
Search
In the SQLdm web console dashboard, you can search for a particular instance by name. Use the percent (%) wildcard character if you do not remember the full name of the instance that you are looking for.
Group by
In the SQLdm web console dashboard, you can group returned information from the different views by Severity and Tags.
Refresh
The Refresh button allows you to manually refresh displayed data.
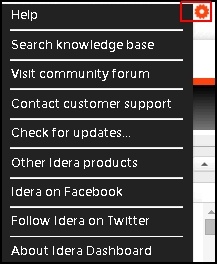
System menu
The system menu provides options for help and navigation to Idera sites such as the knowledge base, community forum, and customer support.