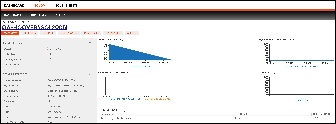
The single instance dashboard includes an overview section for the selected monitored SQL server and specific category views. SQLdm users are able to obtain details on sessions, queries, resources, and databases. Click image to view full size.
|
In the single instance dashboard, you can find the following sections:
- Server status
- Server properties
- Service status
- File use
- Databases roll up view
- Active alerts roll up view
- Charts
- Category views
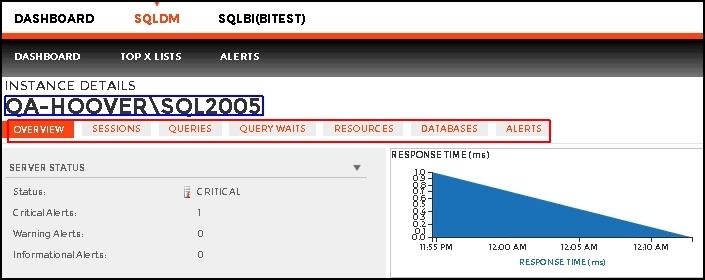
Server status
In this section view the status of your monitored SQL Server and its alerts.
Server properties
In this section view the most important characteristics of your monitored SQL Server instance.
Instance Name
Displays the name of the monitored SQL Server instance.
SQL Version
Indicates the current SQL Server version including service pack and build information on this SQL Server instance.
SQL Edition
Indicates the current SQL Server edition, including Enterprise, Business Intelligence, or Standard, installed on this SQL Server instance.
Running since
Indicates the timestamp associated with the most recent restart of this SQL Server instance.
Clustered
Indicates whether this SQL Server instance is part of a cluster. If it is part of a cluster, SQLdm displays the name of the active node.
Processors
Indicates the total number of processors associated with this SQL Server instance and how many of these processors are currently in use.
Host
Indicates the name of the server hosting this SQL Server instance.
Host OS
Indicates the current operating system on the server hosting this SQL Server instance.
Host Memory (GB)
Indicates the total amount of memory on the server hosting this SQL Server instance.
Service status
In this section view the status of the SQL Server services:
- SQL Server Service
- SQL Agent Service
- Distributed Transaction Coordinator (DTC) Service
File Use
In this section view file use for your monitored SQL Server instance.
Data File(Allocated GB)
Displays the allocated data space in GB for this SQL Server instance.
Data File (Used GB)
Displays the used data space in GB for this SQL Server instance.
Log File (Allocated GB)
Indicates the allocated log space in GB on the SQL Server instance.
Log File (Used GB)
Indicates the used log space in GB on the SQL Server instance.
Database count
Indicates the number of databases contained in the monitored SQL Server.
Databases roll up view
The Databases roll up view shows the monitored databases for the selected instance. Information provided includes:
Database name
Displays the database name.
Creation Date
Displays database creation date and time.
Data Used (MB)
Displays the size of all data files used on this SQL Server instance.
Log Size (MB)
Indicates the current size of the log files on this SQL Server instance.
Status
Indicates the operational status of the database such as Normal, Offline, or Suspect.
If you click any row of the Database roll up view, SQLdm directs you to the database tab of the single instance dashboard for more details.
To sort information in the Databases roll up view, click any of the column headers.
Active alerts roll up view
The Active alerts roll up view shows the active alerts for the selected instance only. Information provided includes:
- Date and time of alert inception
- Alert description
- Monitored SQL Server instance name
- Database name
- Alert category
If you click any row of the Active alerts roll up view, the Alerts Detail Screen displays.
To sort information in the Active alerts roll up view, click the column header of your choice.
Charts
The single instance dashboard includes the following charts:
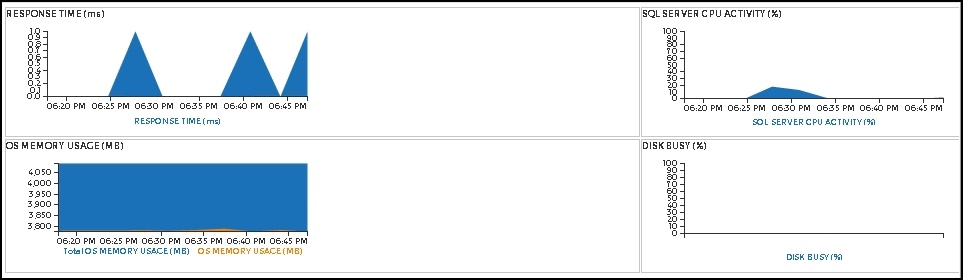
Response Time
The Response Time chart displays the response time (in milliseconds) it takes a Select SQL statement to go to the SQL Server instance and back. This chart indicates the current speed and congestion of the network as well as the speed with which SQL Server processes small queries. To obtain additional key diagnostic statistics for sessions on your SQL Server instance, click on the chart and you’re directed to the Sessions > Overview view. This view contains various charts like the Response Time (ms), Session Activity, and Blocked Sessions.
SQL Server CPU Activity
The SQL Server CPU Activity chart displays the percentage of a CPU consumed by your SQL Server, virtual machine, and host server. To obtain additional key diagnostic statistics for monitoring the resources for your SQL Server instance and computer on which it resides, click on the chart and you’re directed to the Resources > CPU view. This view contains various charts like the CPU Usage (%), Processor Time (%), and Processor Queue Length.
OS Memory Usage
The OS Memory Usage chart displays information in GB on the physical and virtual memory in use during the current day. To obtain additional key memory statistics on the computer hosting your SQL Server instance, click on the chart and you’re directed to the Resources > Memory view. This view contains various charts like SQL Memory Usage (MB), Memory Areas (MB), and Page Life Expectancy (sec).
Disk Busy
The Disk Busy chart displays the percentage of time during the last ten minutes that the disk was not idle for all the disks (combined) on the server that the SQL Server instance resides. To obtain additional key statistics on the way your disks are used on the computer hosting your SQL Server instance, click on the chart and you’re directed to the Resources > Disk view. This view contains various charts like the Disk Reads/Second per Disk, Disk Writes/Second per Disk, and the SQL Server Physical I/O.
Category views
The single instance dashboard contains the Sessions, Queries, Query Waits, Resources, Databases, and Alerts tabs where you can see metrics and information on these category views.
From these tabs you can:
- View your SQL Server sessions information.
- View your SQL Server queries information.
- View your SQL Server query waits information.
- View your SQL Server resources information.
- View your SQL Server databases information.
- View your SQL Server alerts.
Access the single instance dashboard
SQLdm provides several paths to access the single instance dashboard. The first access path is by clicking the appropriate monitored SQL Server instance in the list, thumbnail, or heatmap sub-views. The second access path is by clicking on a specific instance from the Active Alerts panel, or the Most Critical Instances view in the main dashboard. It is also possible to access the single instance dashboard by clicking a specific instance or database in the Top servers by alert count, Top servers by response time, and Top databases by alerts widgets.