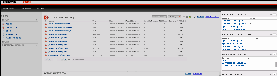
The widgets section of the dashboard provides you with practical access to specific environment information for your day-to-day operations. Click the image to view full size.
|
This section is comprised of the following widgets:
- Top servers by alert count
- Top servers by response time
- Top databases by alerts
- Top alert categories
Top servers by alert count
The Top servers by alert count widget lists the instances with the highest number of alerts in descending order. This widget displays the following information:
- Instance name
- Alert count
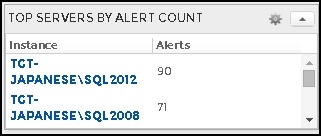
If you click any instance name of a row, the Databases tab of the single instance dashboard displays.
Top servers by response time
The Top servers by response time widget lists the instances with the highest response time in descending order. This widget displays the following information:
- Instance name
- Response time in milliseconds (ms)
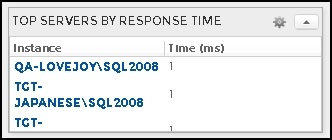
If you click any instance name of a row, the Sessions tab of the single instance dashboard displays.
Top databases by alerts
The Top databases by alerts widget lists the instances that contain the databases with the highest number of alerts in descending order. This widget displays the following information:
- Database name
- Number of alerts
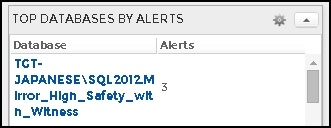
If you click any database name of a row, the Databases tab of the single instance dashboard displays.
Top alert categories
The Top alert categories widget lists the category with the largest number of alerts and displays the following information:
- Category name
- Number of alerts

Alerts’ categories include:
- Custom
- Databases
- Logs
- Operational
- Queries
- Resources
- Services
- Sessions
- Virtualization
If you click any category name, the Alerts Detail screen displays.