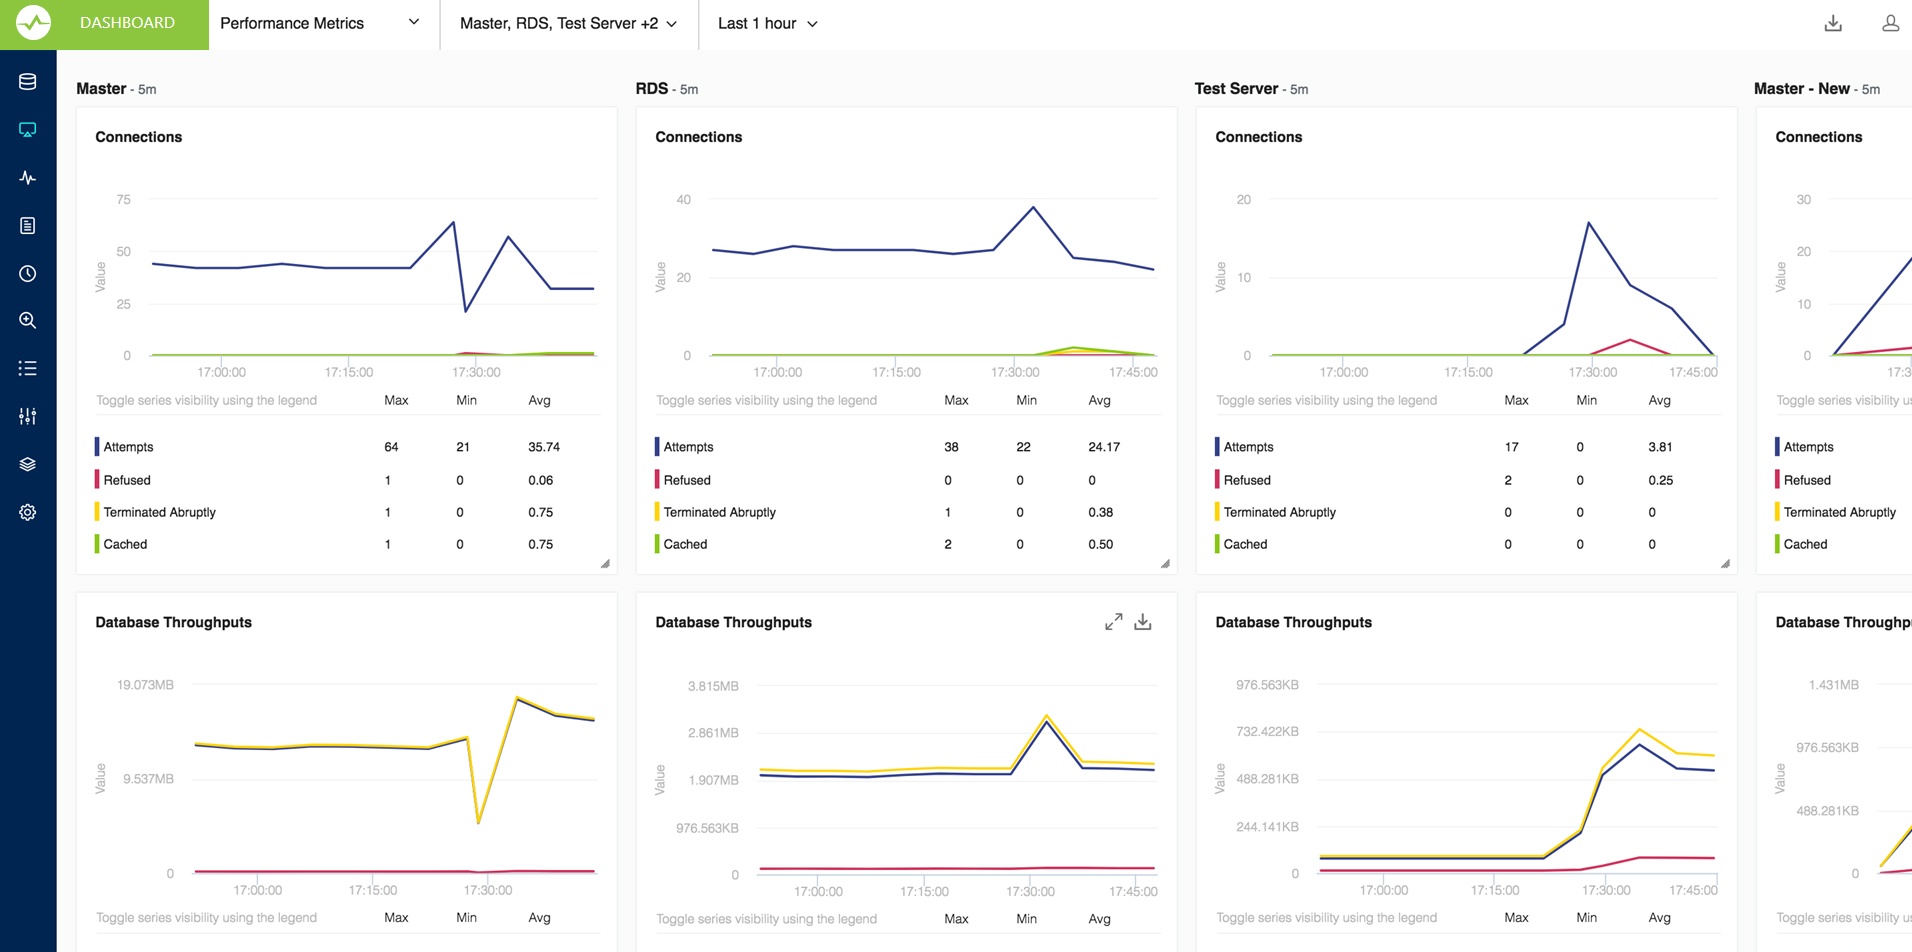
The Dashboard is a page displaying a graphical view of the server parameters and metrics that in most situations will give you a quick overview of the server load and performance. SQL DM for MySQL ships with a default dashboard called "Performance metrics" which includes the metrics:
MySQL metrics:
- Connections
- Cache misses
- Statements
- Database Throughputs
System metrics:
- Disk IO
- CPU usage
How is the refresh interval defined?
Every graph displays related metrics using different colors. In the Charts interface the X-axis timestamps are not printed, and the time interval between each reflects the server-specific setting for the sample interval. By default, the chart displays the last one-hour timeframe. If no data is available for a period because MONyog(SQL DM for MySQL) service was stopped, two empty sample points display in the grid no matter how long time has passed.
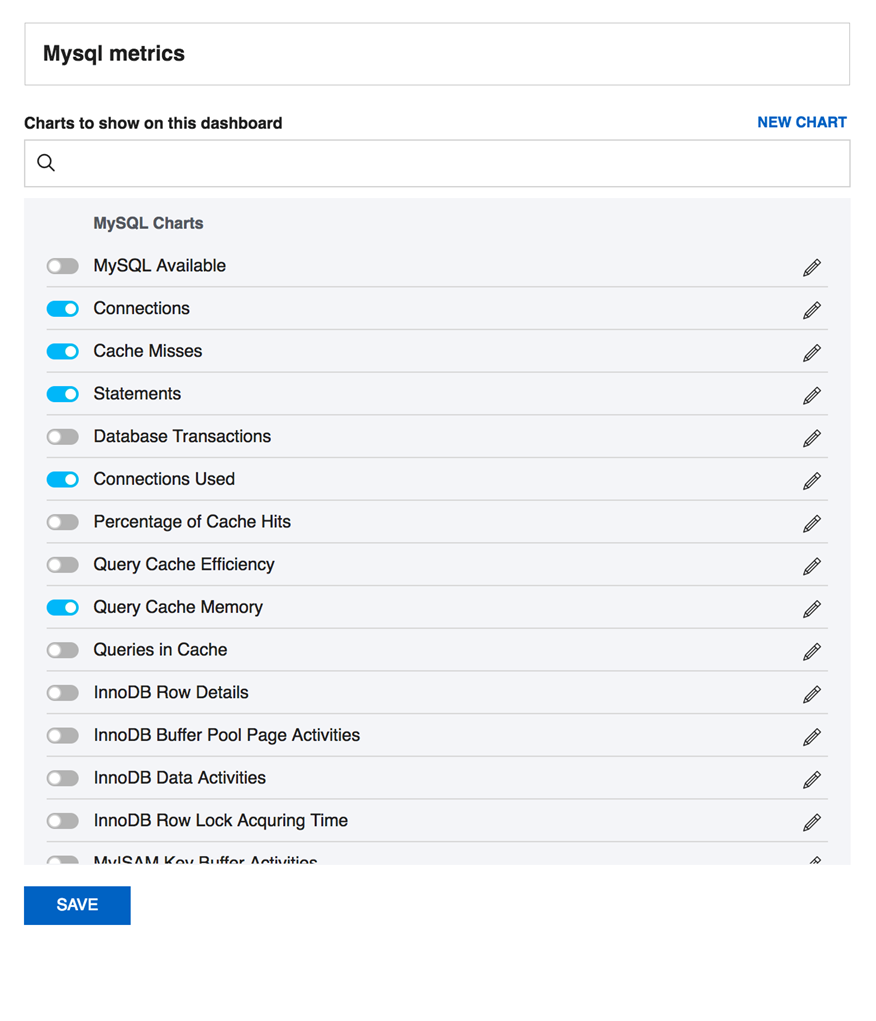
Adding Dashboards
Just click the drop down menu containing the Dashboard names, and select the Add New Dashboard option. This opens the page where you can give a suitable dashboard name and decide which charts to enable for your dashboard.
Dashboards settings
Dahboard settings can be changed from the dashboard page itself. These are local (browser specific) settings that are stored in a cookie.
- The size of the Chart is configurable, you can stretch/reduce the charts size.
- You can hover on the anchor points on the charts to see the actual values.
- You can customize the look of charts by changing the chart color under Settings -> General -> CHART COLOR
- You can rename the dashboard name, add/remove charts to the dashboard, and delete the dashboard from the dashboard name drop-down menu.
Charts recommendation
Recommended number of collections is 50 for better visibility.
This recommendation is based on 1280 x 1024 screen resolution. So, depending upon your screen resolution the number of collections may vary to some extent.
Also, charts can be exported as PDF/JPG/PNG formats, for more information review Exporting graphs.