The Disk Info is an easy to use disk space usage analyzer that allows you to see which MySQL server takes up the most space. It displays number of databases with their data and index sizes. It gives you the snapshot of the disk space occupied by MySQL database objects on your servers as well as a graphical chart display to quickly spot the largest databases.
The Disk information is available at two information levels:
In Database and Table information levels the data are illustrated by a graphical chart (a 'Doughnut' chart type) for an easy overview. If there are few objects only (databases on server or tables in database) they display in the graph.
Overview
Database Level
You reach at this level by clicking the Disk Info option provided for each server in the Servers page. In this view, you get an overview of the space occupied by individual MySQL databases on the server you selected.
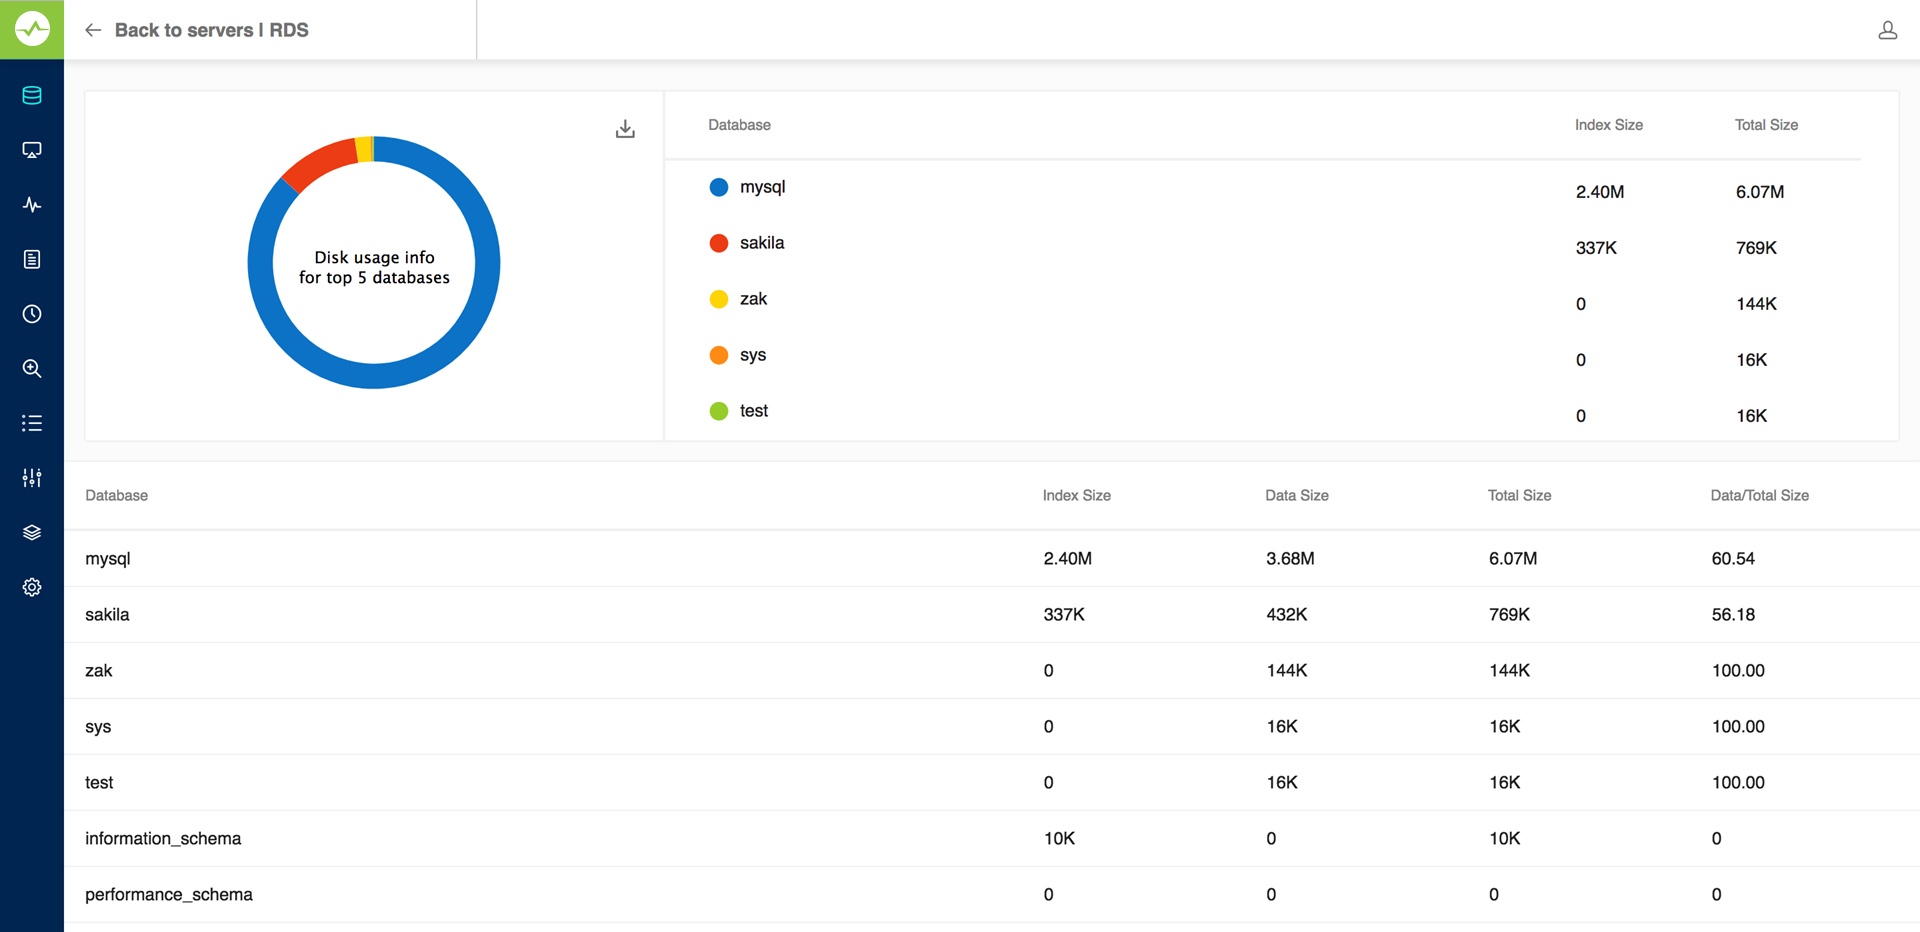
Table Level
You reach at this level by clicking one of the databases in the Database Level view. In this screen, you get an overview of the space occupied by the individual tables in the MySQL database you selected.
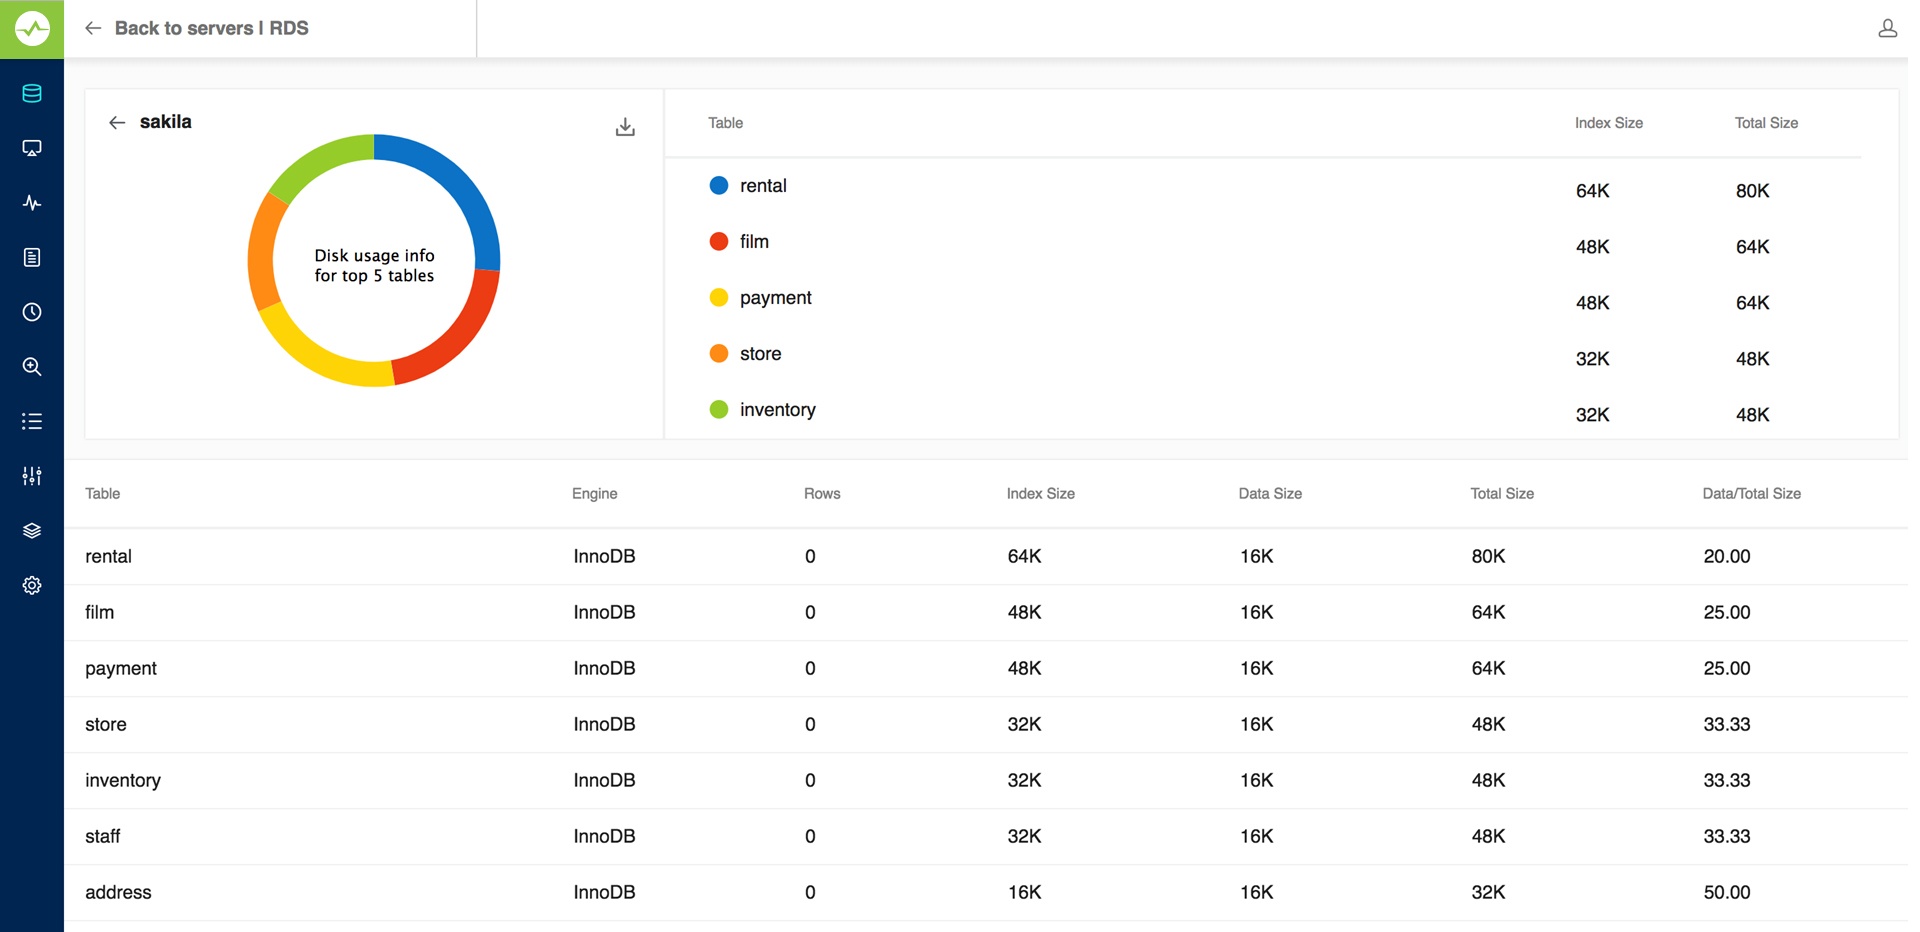
Also, you get a detailed view of the disk space occupied by data and indexes, along with values indicating how efficiently disk space for every object is utilized. Note that for specific table ENGINES such information is not always available and N/A displays.
For table ENGINES having a shared tablespace for all databases like INNODB (if not the file_per_table option is set in configuration) the Connection Level returns the size of the tablespace itself not the cumulative sum of the databases as shown in the Database Level. This may be rather misleading as the tablespace does not shrink when objects are dropped. Same may apply to third-party engines (like SolidDB) also having a shared tablespace for all databases. Also, with third-party ENGINES and ENGINES in beta, other issues may occur that can affect the accuracy and usability of the information. Finally, navigate back to the Database level from the Table level by clicking the database name adjacent to the chart. You can navigate back to the servers page by clicking the Back to servers link.
Disk Info charts displayed can now be exported as JPEG/PNG/PDF formats.