You can zoom into spikes in the charts and get to see the queries involved in the charts, global status, and global system variables for that time range. Just hover over the chart, and click the Show details icon to open the page with the above mentioned information.
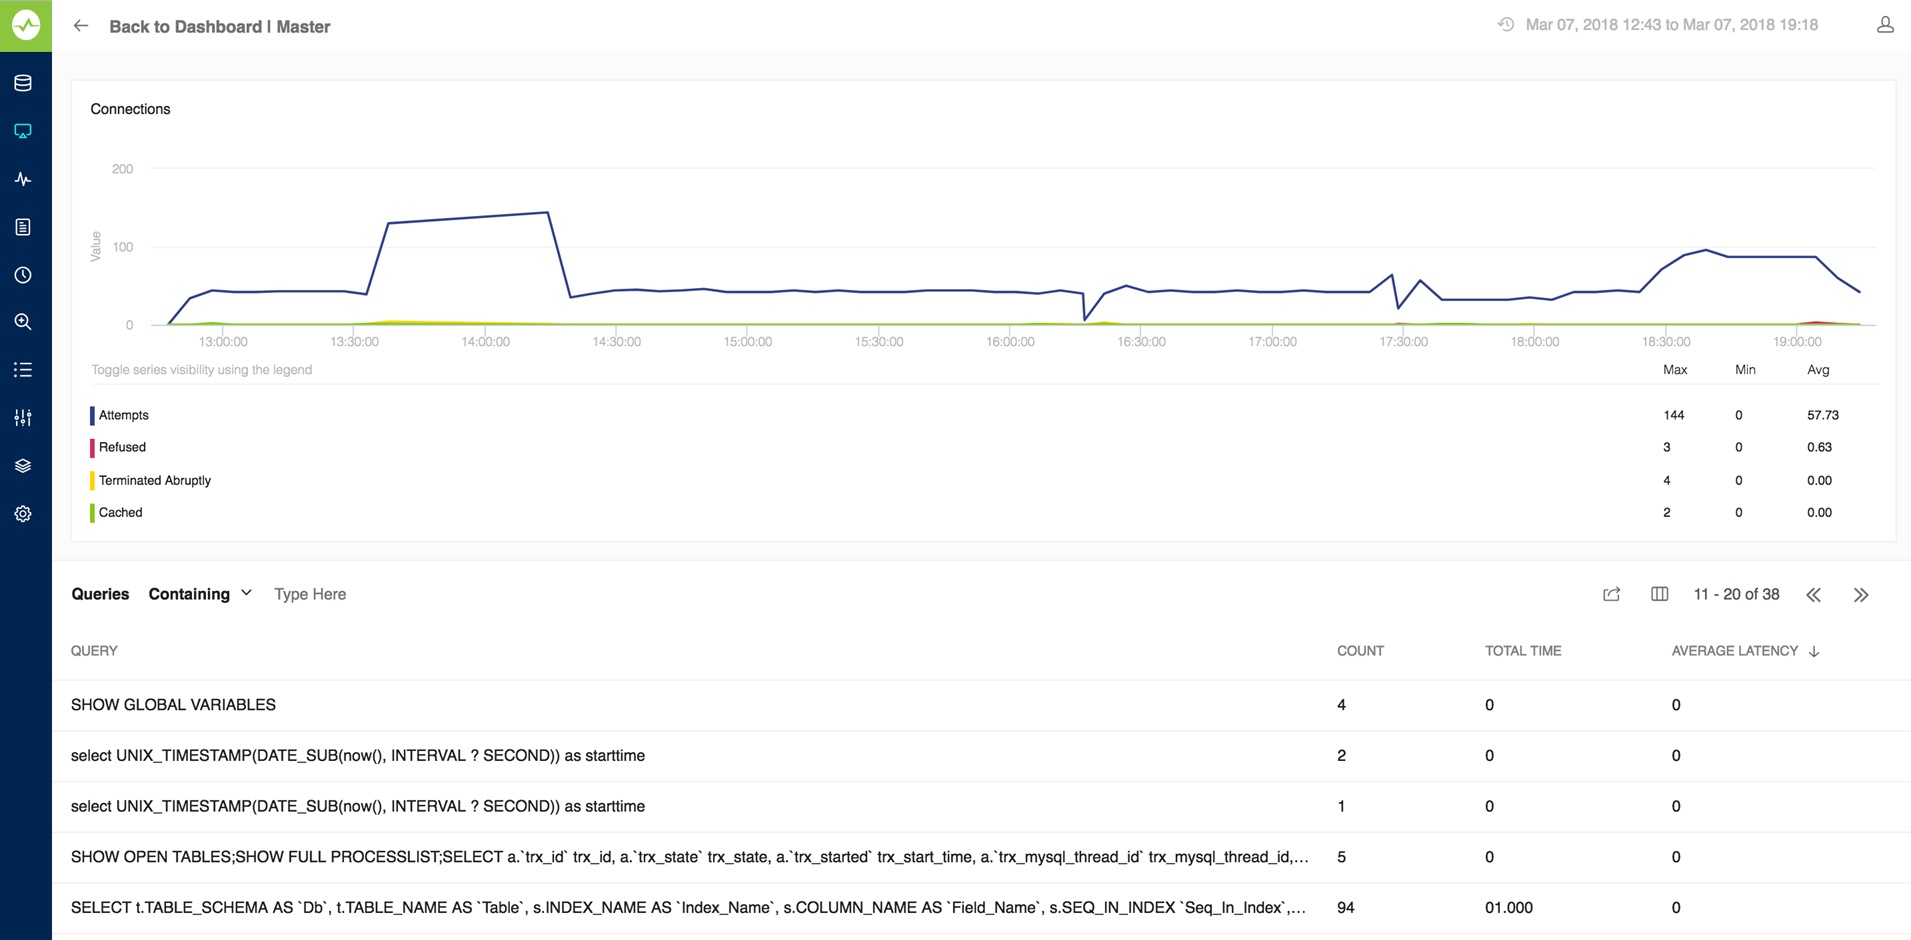
If sniffer was running during this interval, aggregated sniffer information is displayed for the time interval. Also, you can see first and last value of (optionally) all or changed variables aggregated values. The graph is zoomable by selecting a sub-interval with the mouse.
When user clicks a row in the query list, a pop-up opens with information about thread-id, user, and host along with full query.
The list of queries will not be rendered if there are more than 2000 queries in the time period. There is a user control that can be activated in such case. The reason is that every 1000 queries take around 1 seconds to render on an average desktop system. And, it displays the list of queries before zooming (provided still that there not more than 2000 queries to display).