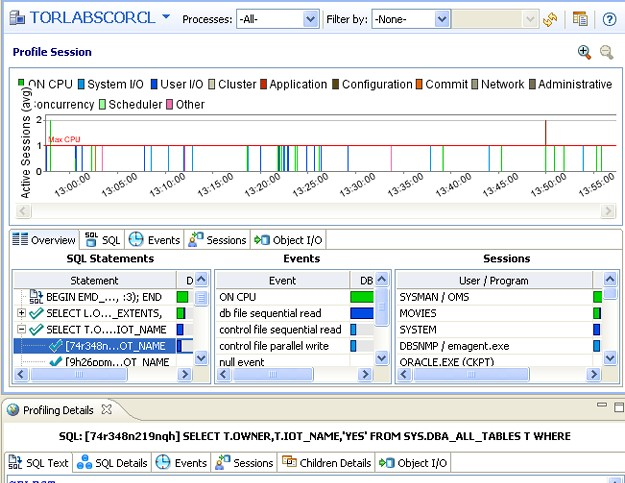
Profiling is monitored and managed via profiling’s three major interface components: the Load Chart, Top Activity Section, and Profiling Details view.
To execute a profiling session
- In Data Source Explorer, right click on the data source you want to profile and select Profile As from the menu, and then choose Data Source 1.
- In the Profile Configurations dialog, select the configuration to use for this profiling session. If you haven’t already created a profile, see Building profiling configurations for a description of the profiling configuration options you can choose.
The profiling session begins. Alternatively, clicking the Profiling icon on the Toolbar automatically runs a profiling session for the last data source you selected.
Once a profiling session launches, it runs until you stop it. When a session has run for a length of time, you can then interpret and analyze the results. See Working with Session Results.
To stop a profiling session
You can stop a profiling session at any time by clicking the Stop button [![]() ] in the upper left-hand side of the Profile Session screen of by clicking the Stop button in the Progress Window.
] in the upper left-hand side of the Profile Session screen of by clicking the Stop button in the Progress Window.
Executing a Session from the Command Line
This is not supported when using SQL Query Tuner InstantOn.
You can launch a profiling session from the command line using the following syntax:
dboptimizer.exe profile ds:ROM*L*ABORCL10G_1 duration:20 tofile:c:\testprofile.oar
In the above command, the user has specified ROM*L*ABORCL10G_1 as the data source, and indicates a profiling session of 20 minutes. The tofile variable specifies the directory and name of the file to which the profiling session will be saved.