Filters can be applied to Problems, SQL Log, and the SQL Errors views to limit searches when troubleshooting and pinpointing specific processes within the system.
To filter the SQL Log
- On the SQL Log view, select the Toolbar Menu icon
 (the downward-pointing arrow in the right-hand corner of the view) and choose Filters. The SQL Log Filters dialog appears.
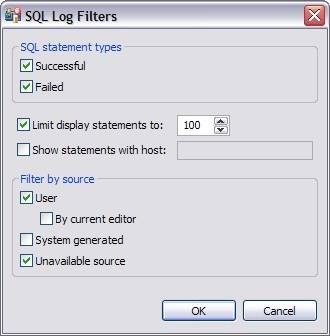
- In the SQL Statement Types frame, select Successful or Failed to filter by the type of Error Log entries.
- Select Limit display statements to indicate a maximum limit of the number of entries displayed in the Error Log, and enter the maximum entry value in the corresponding field.
- Select Show statements with host to indicate that only entries from a specific data source are to be displayed, then type the name of the data source (as it appears in the Database Explorer) in the corresponding field.
- In the Filter by Source pane, specify User, System Generated, or Unavailable Source to filter statements by the type of source from where they originated.
To view and filter the Problems log
- On the Main Toolbar, click Window > Show View > Other > General > Problems.
- On the Problems view, select the options icon and choose Configure Contents. The Configure Contents dialog appears.
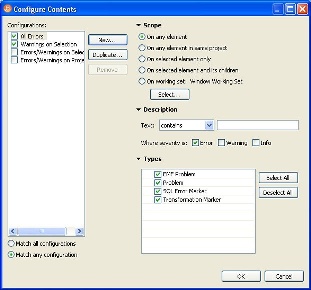
The Configure Contents dialog enables you to create multiple filter profiles that you can apply to the log by clicking the options icon [ ], clicking Show, and then choosing the filter to apply. The Configurations panel on the left-hand side of the dialog displays all existing filter profiles stored in the Workspace. Selecting a configuration displays its filter parameters, and selecting the check box associated with its name enables the filter in the Problems view (only problems that match the criteria defined in the Filters dialog will appear in the view).
The ability to define different profiles enables the selection of multiple filter profiles. For each profile selected, the profile criterion is applied to the View, concurrently. You can filter problems by:
- Working Set
- Character String
- Problem Severity
- Problem Type
- A combination of the above four filter options
| Profile Criteria | Description |
|---|---|
| Working Set | The options located in the Scope area of the dialog enable you to filter problems based on defined Working Sets. A Working Set is a collection of user-defined Project files that you can organize, as needed, in SQL Query Tuner. Select an option, and then click Select to define a Working Set to which the parameters apply. If no Working Sets exist, you need to define one or more via the New button on the Select Working Set dialog. Select one or more Working Sets to which you want the criteria to apply. If no Working Sets exist, or none suitably match the current filter criteria, click New or Edit to define a new Working Set, or edit an exist Working Set, respectively. |
| Character String | Use the Description list to select contains or doesn't contain, as needed, and type the character string in the field below the list. The Problems view is filtered to only contain, or omit, problem descriptions that fully or partially match the string value. |
| Problem Severity | In the Where severity is area, choose Error, Warning, Info or some combination of the three check boxes. Only entries whose severity matches the check boxes you have selected remain visible in the Problems view. |
| Problem Type | The options in the Types list on the right-hand side of the dialog enable you to filter problems by type. For example, deselect Problem to remove any system entries from the view, or deselect SQL Error Marker to remove any SQL code entries from the view. |
Once you have defined and/or selected the appropriate filter profiles, the profiles will appear in the Show submenu in the Toolbar Menu of the Problems view. Select or deselect the profiles from the submenu, as needed.