The profiling interface is divided into three major parts:
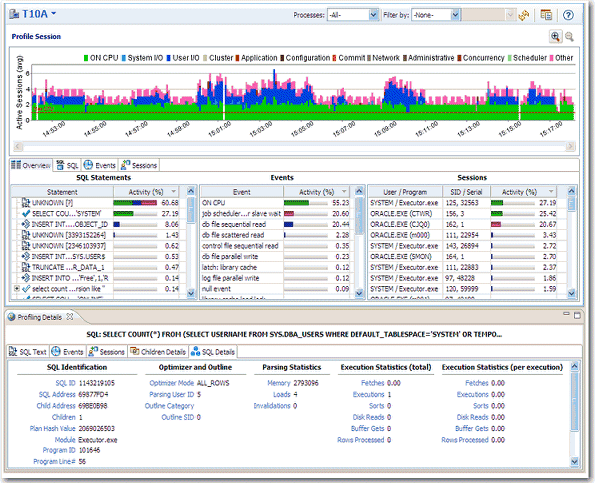
- The Load Graph is located on the top section of the editor and provides a display of the overall load on the system. The bars represent individual aspects of the enterprise, and the view can be used to find bottlenecks.
- Top Activity is located on the middle section of the editor and displays where the load originates. Specifically, the top SQL statements, top events that the database spends time in, as well as the top activity sessions.
- The Profiling Details View is located on the bottom section of the editor and displays detailed information on any item selected in the middle section. For example, an SQL statement, an Event, or a Session.
The graphical portion of the profiling editor presents the distribution of sessions executed over the length of the profiling process, and those that were waiting in DBMS-specific events. It provides a first and most important step in identifying problem areas. Results can be viewed in real-time.
The Load Graph and Top Activity Section compose one view in the editor, while the Profiling Details view is a separate interface component that only activates when an item in the Top Activity Section is specified.
Use a 1280 x 1024 monitor resolution when viewing profiling information. Smaller resolution sizes can obscure details in the view.