What is the IDERA Dashboard?
The IDERA Dashboard is a common technology framework designed to support the entire IDERA product suite. The IDERA Dashboard allows users to get an overview of the status of their SQL Servers and hosted databases in a consolidated view while providing users the means to drill into individual product dashboards for details.
To access the IDERA Dashboard, select IDERA Dashboard from the drop-down menu, next to the IDERA logo.
The IDERA Dashboard is comprised of the following tabs:
- Overview
- Details view
- Alerts view
- Administration
What actions can be performed in the Overview tab of the IDERA Dashboard?
In the IDERA Dashboard users can glance at their registered products overall status through the Overview tab. This tab contains product widgets of all the products registered with the IDERA Dashboard. By default, the Overview tab displays the Overall Status widget.
From the Overall Status widget, you can perform the following actions:
- Click to access the Alerts tab of SQL Workload Analysis.
- Click to access the SQL Workload Analysis and its Side by Side Server Performance window.
- Click to access the SQL Workload Analysis Dashboard.
Click to expand or collapse a widget. You can also view a widget in full size by clicking or remove it by clicking .
Customize the Overview tab
You can customize this view in the Customize DBA Dashboard option of the Administration tab. Click here to learn more.
What actions can be performed in the Details view of the IDERA Dashboard?
In the IDERA Dashboard users can select specific metrics to display in the Details view tab. This tab contains product widgets of all the products registered with the IDERA Dashboard.
Click to expand or collapse a widget. You can also view a widget in full size by clicking or remove it by clicking .
Customize the Details view tab
You can customize this view in the Customize DBA Dashboard option of the Administration tab. Click here to learn more.
What actions can be performed in the Alerts view of the IDERA Dashboard?
In the IDERA Dashboard users can access information on all registered products current alerts and filter them based on:
- Product
- Category
- Severity
- Metric
- Tag
What actions can be performed in the Administration view of the IDERA Dashboard?
In the IDERA Dashboard, all products show a common Administration tab, granted the logged-in user has administrator privileges. Selecting this tab, displays the Administration view which hosts a range of sections for performing administration-related actions.
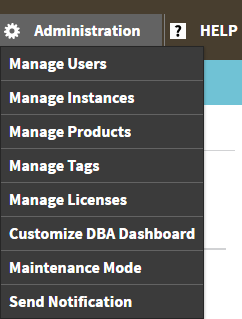
The Administration view of the IDERA Dashboard provides a central set of services related to specific actions such as:
- Managing users
- Managing Products
- Managing Instances
- Customizing Navigation Order
- Dashboard Views
- Managing Tags
- Notifications to all users
- Managing Licenses
For more information on each service and what configuration settings are available, visit each respective section.
You can also access these options from the ADMIN drop-down on the top right corner of the UI.
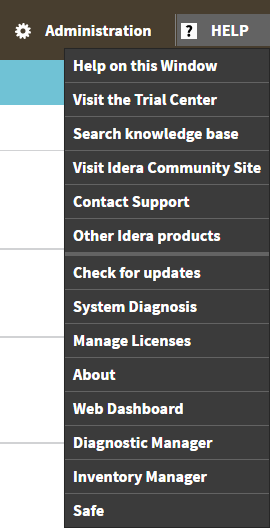
Click the HELP drop-down on the top right corner to access a list of useful support options, tools, information, and products.


