Page History
...
The Listing view helps you to monitor your SQL Server instances with the following information. To do so, you can choose one or more of the diagnostic statistics metrics:
- Status
- Session ID
- Type
- Host
- Blocked By
- Blocking
- CPU (ms)
- Memory Usage
- Physical I/O
- Wait Time (ms)
- User
- Host
- Database
- Open Transaction
- Command
- Application
- Execution Context
- Wait Type
- Wait Resource
- CPU Delta (ms)
- Loging Time
- Physical I/O Delta
- Last Batch
- Blocking Count
- Net Address
- Net Library
- Version Elapsed Seconds
- Transaction
- Current Session
- Session User Space Allocated (kb)
- Session User Space Deallocated (kb)
- Current Task User Space (kb)
- Task User Space Allocated (kb)
- Task User Space Deallocated (kb)
- Current Session Internal Space (kb)
- Session Internal Space Allocated (kb)
- Session Internal Space Deallocated (kb)
- Current Task Internal Space (kb)
- Task Internal Space Allocated (kb)
- Task Internal Space Deallocated (kb)
- Last Command
...
The Sessions view presents two ways of filtering your session instance information using the following options:
Time Range Filter
To monitor the sessions server status in a frame time use the time range filter. Modify the start and end time and date according your needings.
...
The first one, consists
...

Session Filter
To monitor your sessions by type, you can click on one of the next options to display data:

- Sessions - Filters all the sessions across your SQL Server instances
- Blocked - Filters the blocked SQL Server instances
- Blocking - Filter the blocking SQL Server instances
Comlumn Filter
To filter specific criteria by column, select a column, click on the ![]() icon next to the icon's name, select the Filter option, and select or type the searching criteria.
icon next to the icon's name, select the Filter option, and select or type the searching criteria.
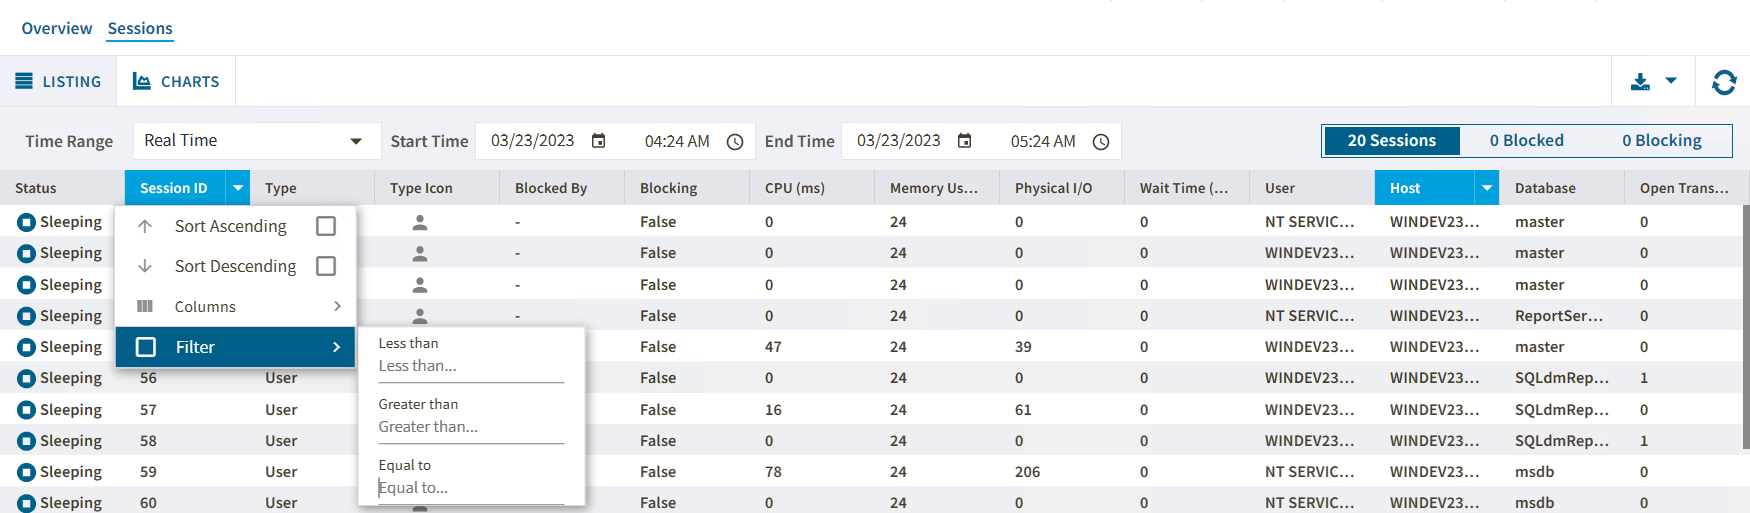
| Info |
|---|
When using the Column filter, consider that each column has its own selection criteria. |
Check Session Details
The Session tab allows you to get a detailed summary for each session. To check the sessions details, double click in a specific session and the following window will pop up.
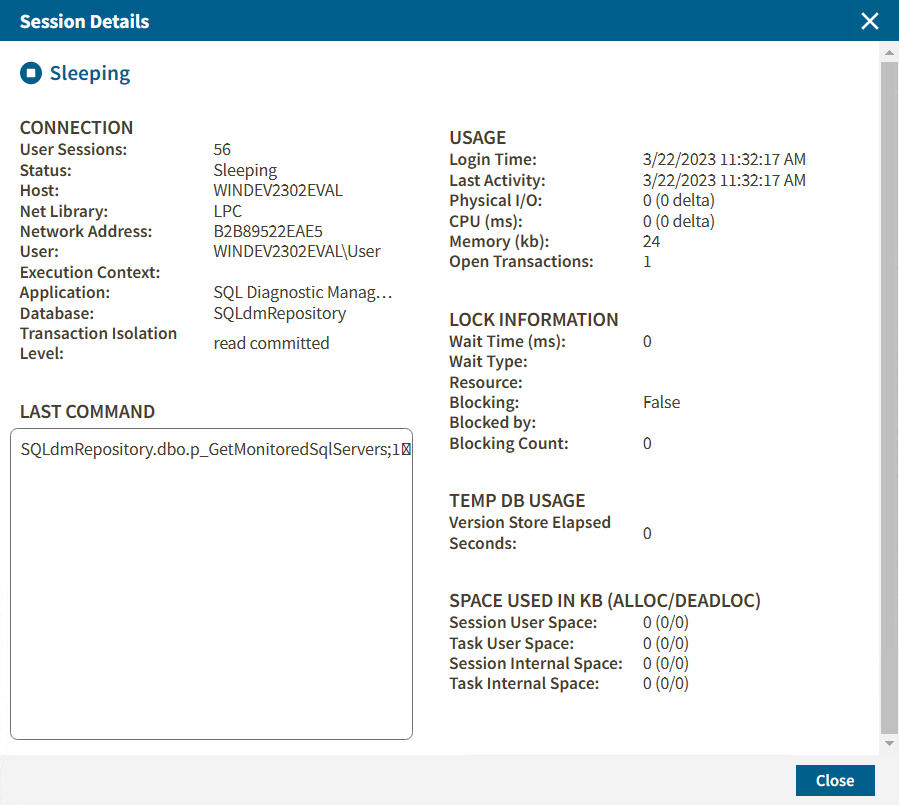
In the Session Details window you will find sessions data regarding to
- Connection information
- Usage metrics
- Last Command used
- Lock Information metrics
- Temp DB Usage metrics
- Space used in kb (alloc/deadloc) metrics
Anchor Chart Chart
Charts
| Chart | |
| Chart |
The Sessions > Sessions Graphs tab contains the following charts (Click image to view full size):
...