The single instance dashboard provides you with the Sessions tab which allows you to quickly view key diagnostic statistics for sessions on your SQL Server instance and contains the following views:
Listing
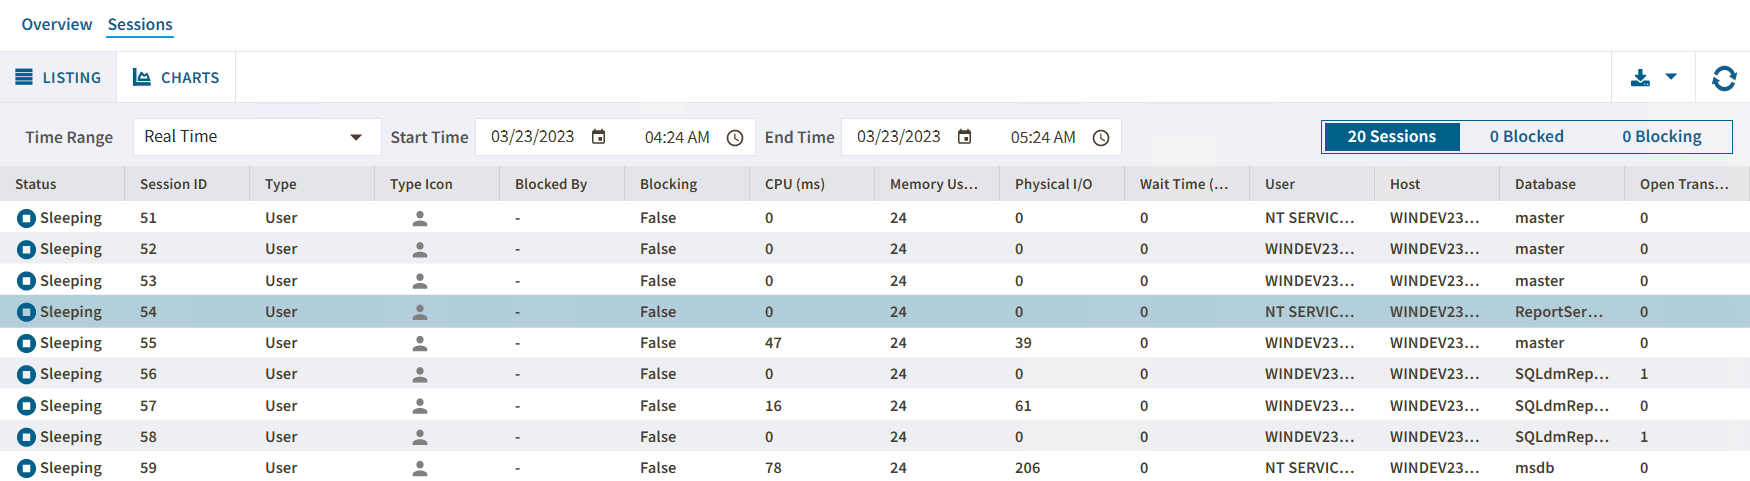
The Listing view helps you to monitor your SQL Server instances. To do so, you can choose one or more of the diagnostic statistics metrics:
- Status
- Session ID
- Type
- Host
- Blocked By
- Blocking
- CPU (ms)
- Memory Usage
- Physical I/O
- Wait Time (ms)
- User
- Host
- Database
- Open Transaction
- Command
- Application
- Execution Context
- Wait Type
- Wait Resource
- CPU Delta (ms)
- Loging Time
- Physical I/O Delta
- Last Batch
- Blocking Count
- Net Address
- Net Library
- Version Elapsed Seconds
- Transaction
- Current Session
- Session User Space Allocated (kb)
- Session User Space Deallocated (kb)
- Current Task User Space (kb)
- Task User Space Allocated (kb)
- Task User Space Deallocated (kb)
- Current Session Internal Space (kb)
- Session Internal Space Allocated (kb)
- Session Internal Space Deallocated (kb)
- Current Task Internal Space (kb)
- Task Internal Space Allocated (kb)
- Task Internal Space Deallocated (kb)
- Last Command
You can configure the columns displayed in the Listing view by clicking the option ![]() icon, hovering the mouse over the column option, and choosing the metrics of your interest.
icon, hovering the mouse over the column option, and choosing the metrics of your interest.
Besides displaying diagnostic statistics of the monitored SQL Server instance, the Lisinting view allows you to perform the following actions:
Filter Information
The Sessions view presents ways of filtering your session instance information using the following options:
Time Range Filter
To monitor the sessions server status in a frame time use the time range filter. Modify the start and end time and date according your needings.

Session Filter
To monitor your sessions by type, you can click on one of the next options to display data:

- Sessions - Filters all the sessions across your SQL Server instances
- Blocked - Filters the blocked SQL Server instances
- Blocking - Filter the blocking SQL Server instances
Comlumn Filter
To filter specific criteria by column, select a column, click on the ![]() icon next to the icon's name, select the Filter option, and select or type the searching criteria.
icon next to the icon's name, select the Filter option, and select or type the searching criteria.
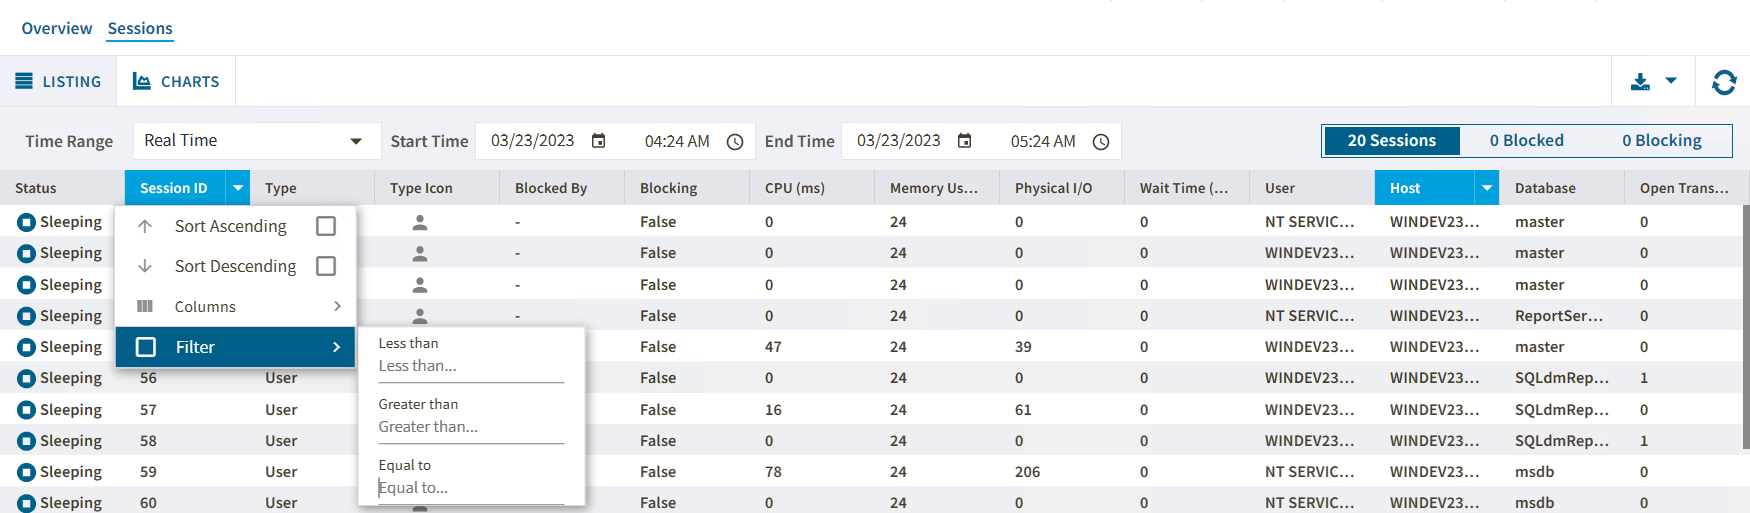
When using the Column filter, consider that each column has its own selection criteria.
Check Session Details
The Session tab allows you to get a detailed summary for each session. To check the sessions details, double click in a specific session and the following window will pop up.
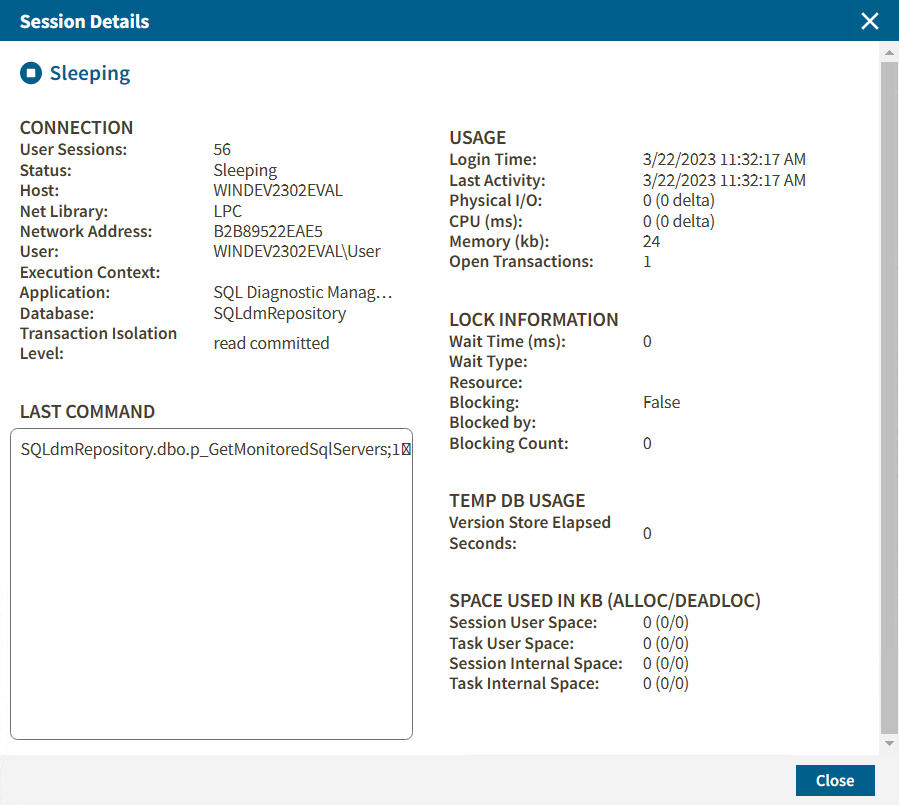
In the Session Details window you will find sessions data regarding to
- Connection information
- Usage metrics
- Last Command used
- Lock Information metrics
- Temp DB Usage metrics
- Space used in kb (alloc/deadloc) metrics
Charts
The Sessions > Sessions Graphs tab contains the following charts (Click image to view full size):
Response Time (ms)
The Response Time chart displays the response time (in milliseconds) it takes a Select SQL statement to go to the SQL Server instance and back. This chart indicates the current speed and congestion of the network as well as the speed with which SQL Server processes small queries.
Session Activity
The Session Activity chart displays the number of concurrent connections to the monitored SQL Server instance over time. The total number of sessions includes the active, idle, and system sessions.
Blocked Sessions
The Blocked Sessions charts lists all the Blocked Sessions, Lead Blockers, and the Total Deadlocks for the selected SQL Server instance. This allows you to easily view blocks as they occur.
Access the Sessions tab
SQL Diagnostic Manager provides three paths to access the Sessions tab. The first access path is by clicking on the Response Time chart (ms) of the single instance dashboard, and you are directed to the Sessions > Overview tab. The second access path is by selecting the Sessions tab of the single instance dashboard. You can also click on an alert that belongs to the Sessions category in the Active alerts panel of the main dashboard.