Page History
Query Monitor is a useful SQL Server SQL Server tool that allows you to log and analyze queries. Query Monitor allows you to establish criteria for the queries you wish to capture, and filter those results to analyze the queries returned. Use the Query Monitor when diagnosing poor query performance on your SQL Server SQL Server instance. You should monitor queries if your SQL Server SQL Server instance performance is poor, as a way to diagnose potential query issues.
| Tip |
|---|
To explore query data in multiple ways and get a handle on queries in your system, try our New advanced query views of the SQL Diagnostic Manager web console. |
Access the Queries tab
SQL Diagnostic Manager provides two paths to access Access the Queries tab . The first access path is by clicking the appropriate monitored SQL Server SQL Server instance, and then clicking the Queries tab. The second access path is by expanding the Servers tree, and then clicking Queries for the appropriate instance.
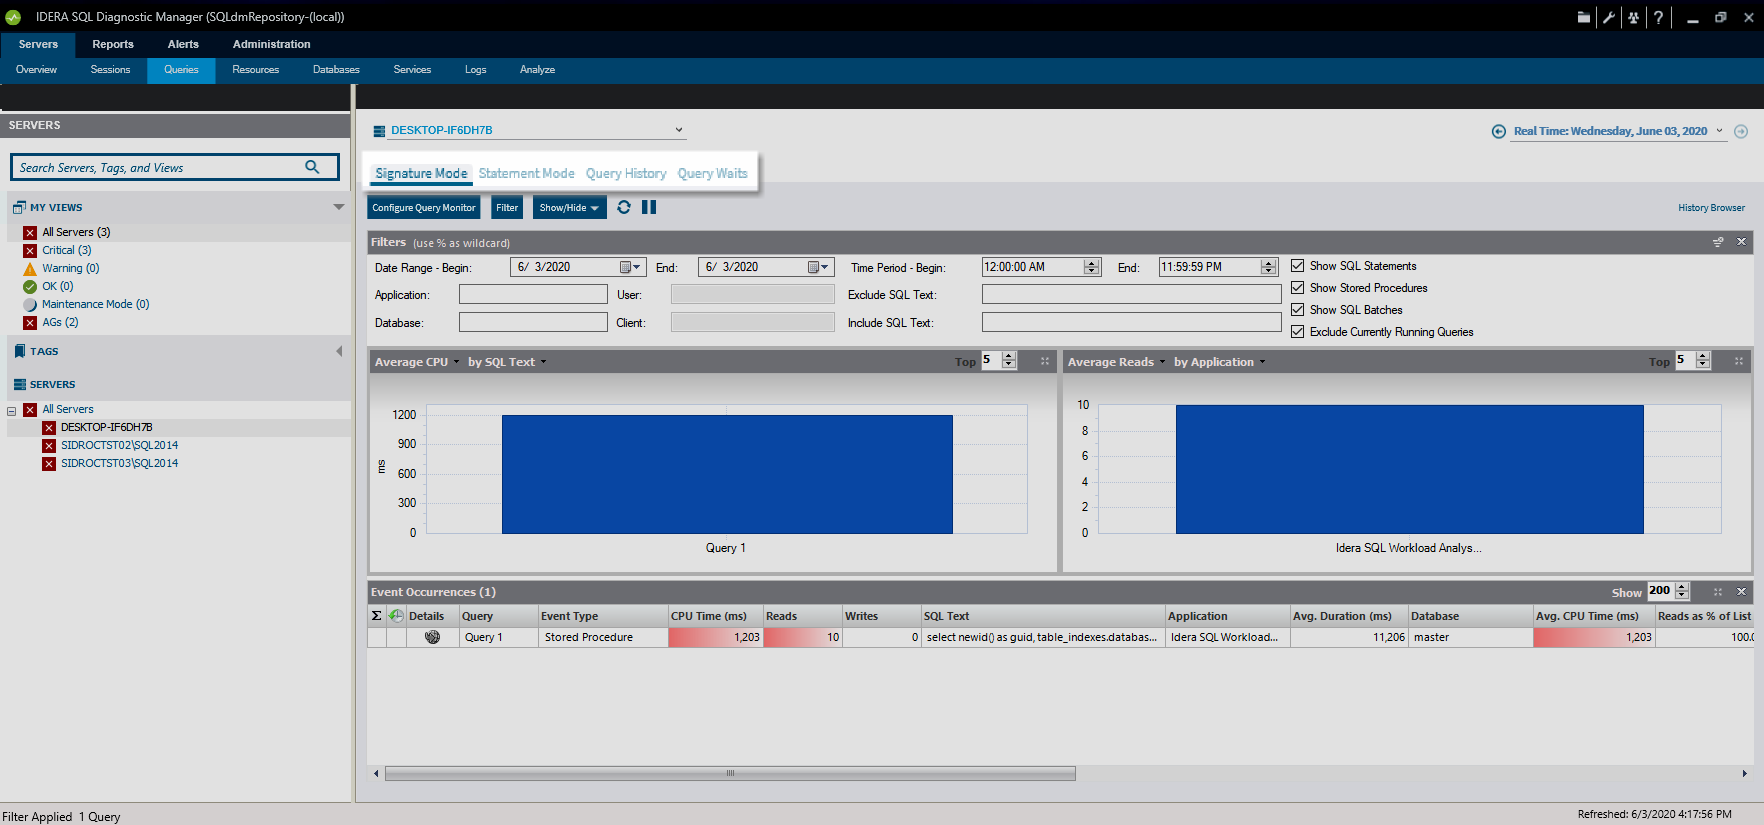
Use the Queries tab
The Queries tab lists each event that occurs in the Query Monitor. For each event, among other details, SQL Diagnostic Manager lists the SQL text associated, start and end times, application, user information, and client computer associated with the event. Fields with SQL text SQL text hold 255 characters of text. To view the full SQL textSQL text, right-click the field and then select the appropriate option.
SQL Diagnostic Manager automatically assigns a name to each of your queries starting with Query 1. The name provides context to your query when switching from Signature Mode , Statement Mode , Query History, and Query Waits views.
...
The Sigma (Σ) character indicates that the data in this row is at least partially composed of aggregated data. This means that the data is condensed into a day-length summary and some precision about the individual statements, client computers, and users is suppressed. Rows in this view with the Sigma character may include a mix of aggregated and non-aggregated data.
Understand the difference between Signature Mode and Statement Mode
Signature and Statement modes are two different ways to group and view your queries. You can toggle between each mode to see the differences.
Signature Mode (default Queries view)
All active queries are automatically reduced to the signatures (parameters are stripped) and grouped accordingly.
| Tip |
|---|
You can also view signatures in the Advanced query signature view of the SQL Diagnostic Manager web console. |
...
All queries are presented exactly as they are collected by the Query Monitor Trace.
Use Filter Settings to customize your view
...
| Tip |
|---|
The Include incomplete queries filter in the Signature Mode and Statement Mode views is disabled by default. If you would like to include data with null values in these views, select the Include incomplete queries check box in the Filters section. |
...