Versions Compared

Key

  • This line was added.
  • This line was removed.
  • Formatting was changed.

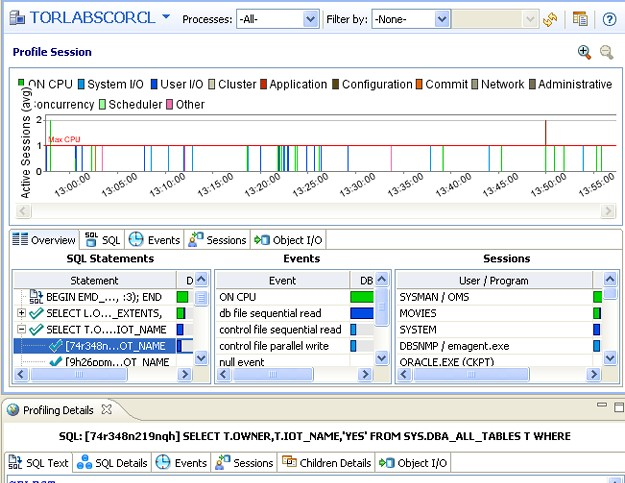
Wiki MarkupProfiling is monitored and managed via profiling's profiling’s three major interface components: the Load Chart, Top Activity Section, and Profiling Details view. \\ !worddav0e93d86780177bc4274c4908f0a3b6ce.png|height=483,width=624! \\ \\ *To* *execute* *a* *profiling session:* 1In Data Source Explorer, right click on the data source you want to profile and select *Profile* *As* from the menu, and then choose *Data* *Source* *1{*}. \\ 2In the *Profile* *Configurations* dialog, select the configuration to use for this profiling session. If you haven't already created a profile, see [Building Profiling Configurations|BUILDING PROFILING CONFIGURATIONS] for a description of the profiling configuration options you can choose. \\ The profiling session begins. Alternatively, clicking the Profiling icon on the Toolbar automatically runs a profiling session for the last data source you selected. \\ Once a profiling session launches, it runs until you stop it. When a session has run for a length of time, you can then interpret and analyze the results. See [Work with Session Results|WORK WITH SESSION RESULTS]. \\ \\ *To* *stop* *a* *profiling session:* You can stop a profiling session at any time by clicking the *Stop* button \[ !worddave1b038e652577d4ec7e878480f414dcd.png|height=13,width=15! \] in the upper left-hand side of the Profile Session screen of by clicking the Stop button in the Progress Window. !worddava86dd622549dfa230117039d6d4c2b7b.png|height=200,width=615! \\ \\ \\ *Executing* *a* *Session* *from* *the* *Command* *Line* <span style="color: #444087">NOTE:</span> This is not supported when using SQL Query Tuner InstantOn. \\ \\ You can launch a profiling session from the command line using the following syntax: \\ dboptimizer.view.

Image Added

To execute a profiling session

  1. In Data Source Explorer, right click on the data source you want to profile and select Profile As from the menu, and then choose Data Source 1.
  2. In the Profile Configurations dialog, select the configuration to use for this profiling session. If you haven’t already created a profile, see Building Profiling Configurations for a description of the profiling configuration options you can choose.

The profiling session begins. Alternatively, clicking the Profiling icon on the Toolbar automatically runs a profiling session for the last data source you selected.

Once a profiling session launches, it runs until you stop it. When a session has run for a length of time, you can then interpret and analyze the results. See Work with Session Results.

To stop a profiling session:

You can stop a profiling session at any time by clicking the Stop button [ ] in the upper left-hand side of the Profile Session screen of by clicking the Stop button in the Progress Window.

Executing a Session from the Command Line

This is not supported when using SQL Query Tuner InstantOn.

You can launch a profiling session from the command line using the following syntax:

dboptimizer.exe profile exe profile ds:ROM*L*ABORCL10G_1 duration:20 tofile:c:\testprofile.oar

\\ In the above command, the user has specified ROM*L*ABORCL10G_1 as the data source, and indicates a profiling session of 20 minutes. The _ tofile _ variable specifies the directory and name of the file to which the profiling session will be saved. \\ \\ \\ \\