Page History
The Alerts Detail screen in the SQL Diagnostic Manager web console SQLDM Web Console provides you with detailed statistics on your alerts.
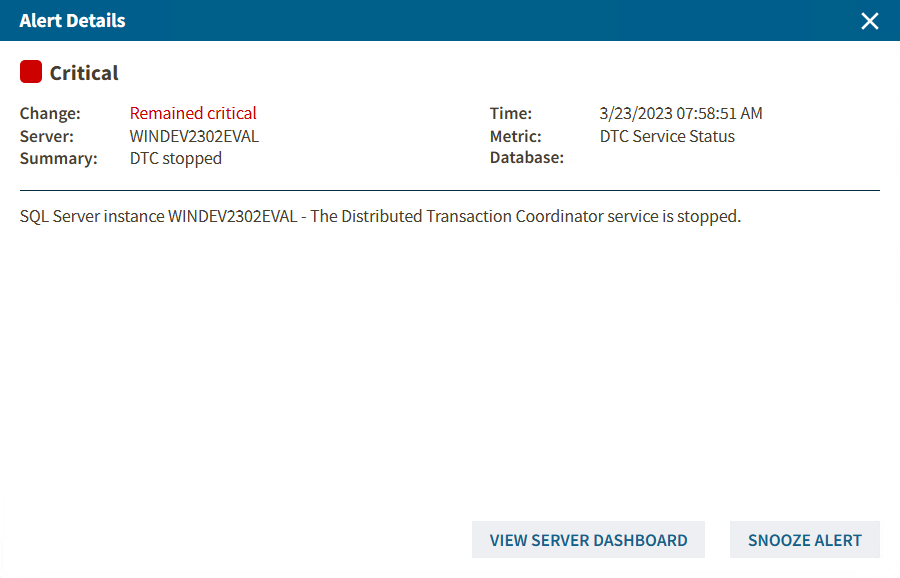
On the Alerts Detail screen you can find the following information:
- Alert Name
- Instance Name
- Value
- Current alert time
- Warning Threshold
- Status
- Change
- Server
- Summary
- Time
- Metric
- DatabaseCritical Threshold
- Alert Details
Additional button options
...
View Server Dashboard
You can access
...
Click the SHOW CATEGORY DETAILS button to access first the Overview tab of a single instance and then directly from the Alert Details window by clicking the VIEW SERVER DASHBOARD button to check specific category views such as sessions, queries, query waits, resources, databases, and alerts.
Instance
Click the SHOW INSTANCE DETAILS button to access the single instance dashboard for a specific instance.
Close
Click the CLOSE button to exit the Alerts Detail screen.
Prev
Click the PREV button to view details for a previous alert.
Next
Click the NEXT button to view details for the next alert.
Metric history
View alert history for the past 4 hrs, 24 hrs or 7 Days.
Launch SQL Diagnostic Manager
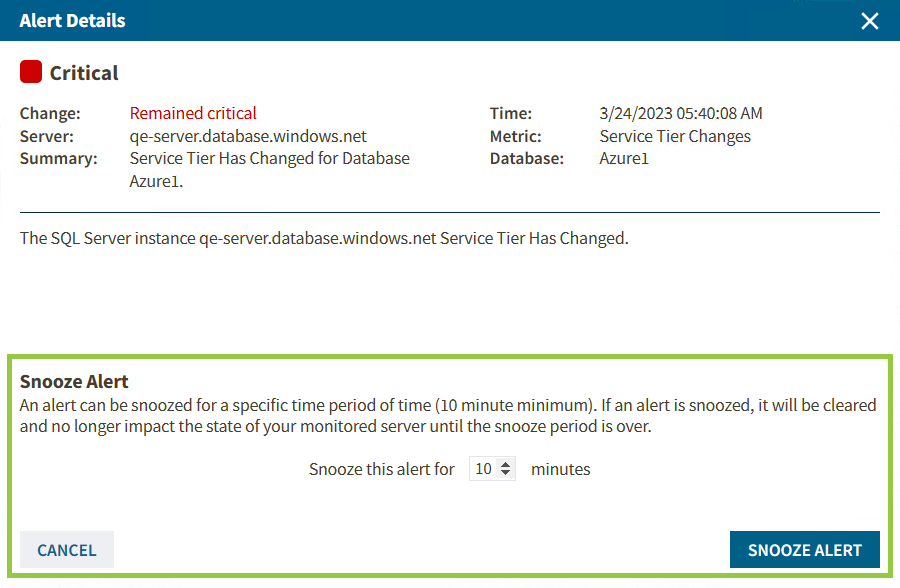
Snooze Alert
You can snooze a specific alert by clicking the SNOOZE ALERT button and configuring the snooze time as shown in the image.
 Click the SQL Diagnostic Manager icon
 to launch the SQL Diagnostic Manager Console.
Access the Alerts Detail screen
SQL Diagnostic Manager SQLDM Web Console provides several paths to access the Alerts Detail screen. The first access path is by clicking any row in the alerts roll-up view of the Alerts tab. The second access path is by clicking over a category icon in the thumbnail sub-view that contains active alerts. It is also possible to access the Alerts Detail screen through the SQL Diagnostic Manager web console's home tab and the specific widgets it containsan alert row in the Alerts section of the single instance Overview tab.