Page History
...
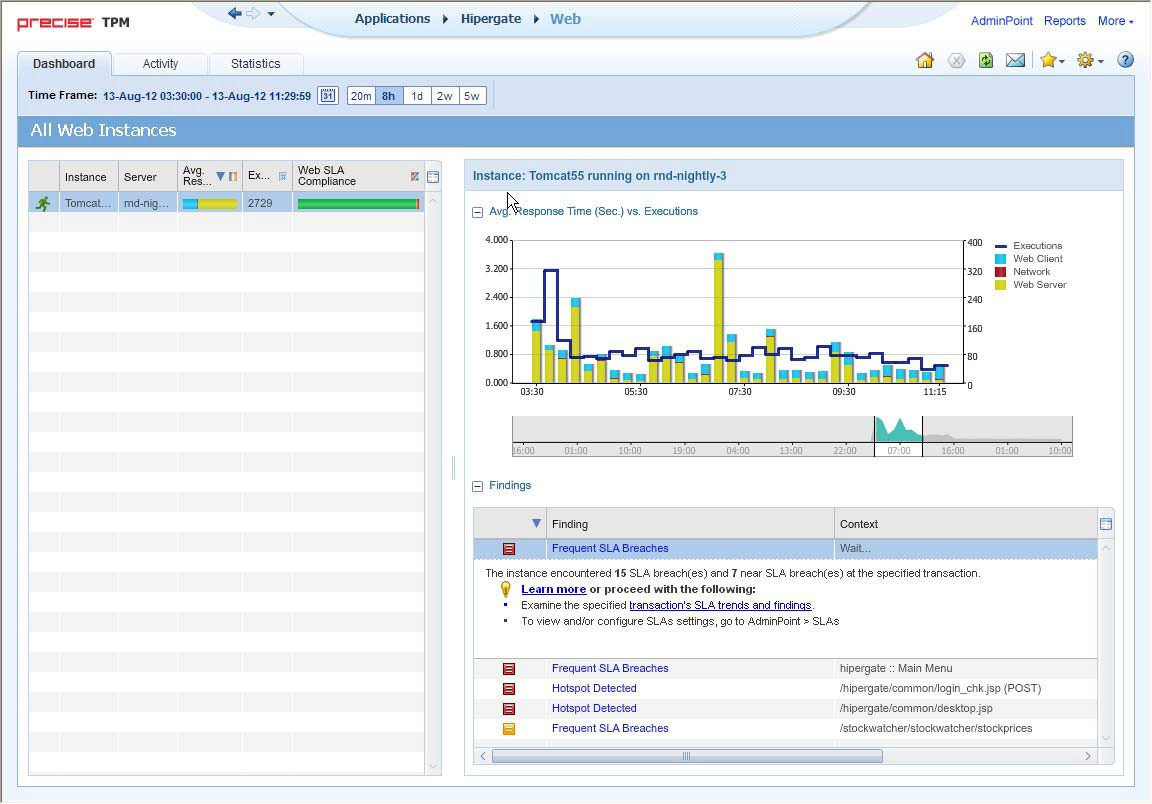
The Dashboard tab is divided into three areas: the Main area, the Association area, and the Associated Findings area. The Main area lists all the instances that belong to the Tier. The Association area and Associated Findings area provide more extensive information on the selected instance.
Figure 3- 1 Dashboard tab
About the Main area in the Dashboard tab
...
The table below describes the information displayed in the Main area when client-side collection (with server-side collection) is configured.
Table 3- 1 Client-side collection (with server-side collection)
...
This area is divided into two sections. The top section shows an overtime graph of the average response time vs. executions. The bottom section shows the findings. Clicking on the hyperlinked finding title or following step of the finding launches, in context, to the related tab from which the data was derived.
Precise. Performance intelligence from click to storage. Learn more > >
...