Page History
The Query Monitor Signature Mode view includes all active query information, automatically reduced to the signatures and grouped accordingly. Note that the parameters are stripped.
| Tip |
|---|
If you want to prevent certain queries from appearing on the Query Monitor views, click Configure Query Monitor > Advanced and enter the applications, databases, or SQL text you want to exclude from the Query Monitor collection. You can also configure these options directly in the SQL Diagnostic Manager web console. |
The Query Monitor Signature Mode view is the place to start when investigating query performance. It broadly defines queries and trends with a less overwhelming amount of data and allows you to diagnose a query in a general sense. Once you identify a potential problem, you may want to view the statement mode view to see why a query is experiencing performance problems for a particular user, and then to the query history to see how the query performs over time and the associated trends.
The primary focus of the Signature Mode view is in the charts. The chart type drop-down allows you to pick a chart type to view, while the chart category drop-down allows you to choose to view the data by SQL Text, Application, or Database.
Use Query filters to narrow the results to only those that most interest you. Do this by selecting the date and time range, the application, user, database, workstation, and the SQL text you want to include or exclude from your results.
Event Occurrences is a listing of each occurrence of the query and the associated statistics, such as the duration, CPU time, reads, writes, and associated SQL text.
| Tip |
|---|
If Query Monitor is disabled but Activity Monitor is enabled, SQL statements appearing in the Event Occurrences grid come from the Blocking Session collector. The collector only populates the following fields: Query, SQL text, Occurrences, Event Type, and Average Deadlocks. |
| Note |
|---|
The Include incomplete queries filter in the Signature Mode view is disabled by default. If you would like to include data with null values in this view, select this check box in the Filters section. |
Access the Signature Mode view
You can open the Signature Mode view of the SQL Diagnostic Manager Queries tab by selecting the appropriate SQL Server instance, and then clicking Queries > Signature Mode.
| Info |
|---|
You can also access the Query Signature Mode view through the Query tab of the SQL Diagnostic Manager web console. For more information on the new advanced query views, see View your SQL Server queries information. |
| Tip | ||
|---|---|---|
| ||
Sigma (Σ) character
The Sigma character indicates that the data in this row is at least partially composed of aggregated data. This means that the data is condensed into a day-length summary and some precision about the individual statements, client computers, and users is suppressed. Rows in this view with the Sigma character may include a mix of aggregated and non-aggregated data.
Understanding cell colors
Red in the column indicates that the data in that row represents 20 percent or more of the total data displayed in the list, while yellow indicates that the data in the row represents 5 percent or more of the total data displayed in the list.
Details window provides various views with detailed information on each query. The Query Details view is comprised of the following tabs:
| Note |
|---|
| The Plan Diagram and Plan XML views are only available for instances running SQL Server 2008+. |
| Anchor | ||||
|---|---|---|---|---|
|
The Plan Diagram (estimated) is a visual representation of the query execution plan (actual or estimated) available in XML format in SQL Server. The Plan Diagram displays a view of the tree of operations that make up a query. This tree shows individual operation nodes, pertaining graphical execution plan icon, along with basic information such as operator name and operation percentage of total cost.
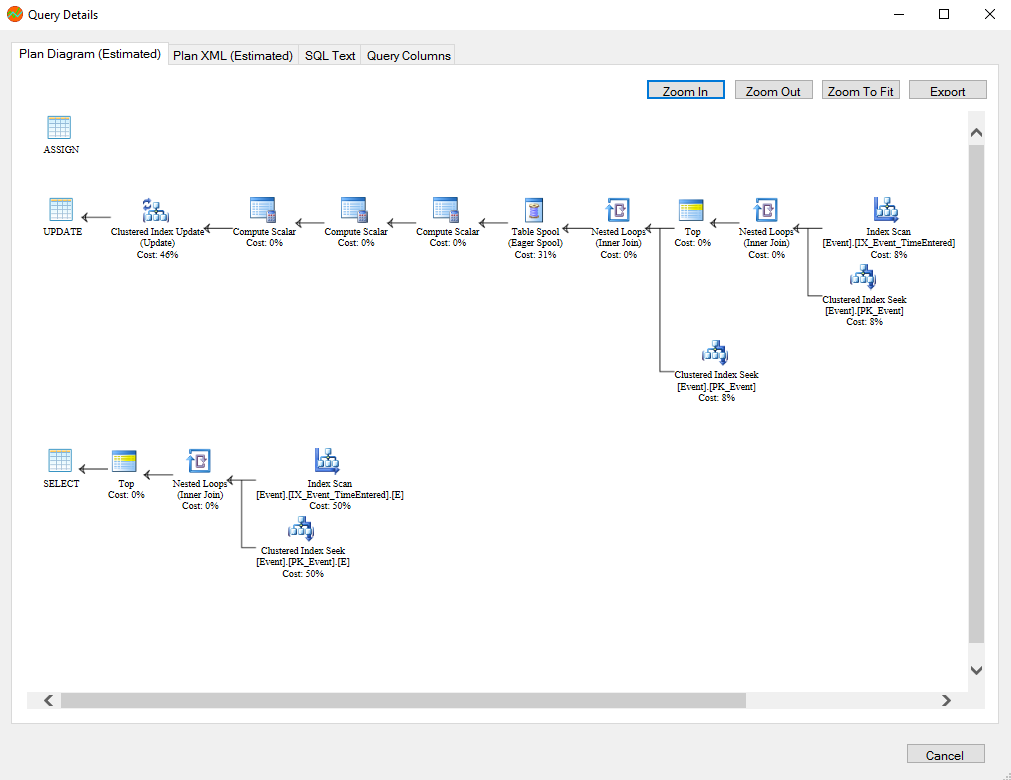
In the Plan Diagram view you can perform the following actions:
- Select individual operators and view the set of properties for each operator.
- Increase the size of the image (Zoom in).
- Reduce the image size (Zoom out).
- Select a size for the view so that fits the current view size (Zoom to fit).
- Export image of Plan Diagram.
| Info |
|---|
| The top three operator based on the percentage of total cost in a Plan Diagram are highlighted in yellow. |
| Tip | ||
|---|---|---|
| ||
SQL Diagnostic Manager displays information on whether the plan displayed is an estimated query plan or an actual one. |
Anchor xml xml
Plan XML
| xml | |
| xml |
The Plan XML of the Query Details window displays the actual XML of the query execution plan. It has a syntax-highlighting (color-coded) XML viewer.
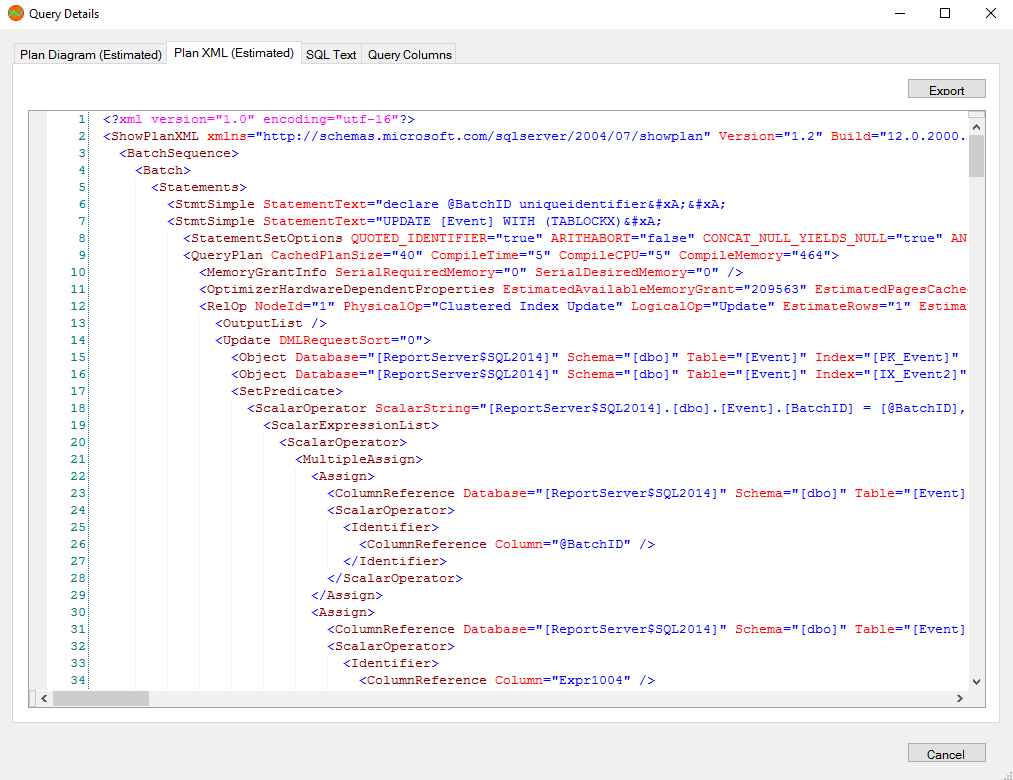
In the Plan XML view you can perform the following actions:
- Export and save XML file for review in other application such as SSMS or email query execution plan to other DBAs.
| Warning |
|---|
Save the file with .sqlplan extension to view the graphical query plan in SSMS. |
| Anchor | ||||
|---|---|---|---|---|
|
The SQL Text tab of the Query Details window shows the underlying SQL Text for the query execution plan.
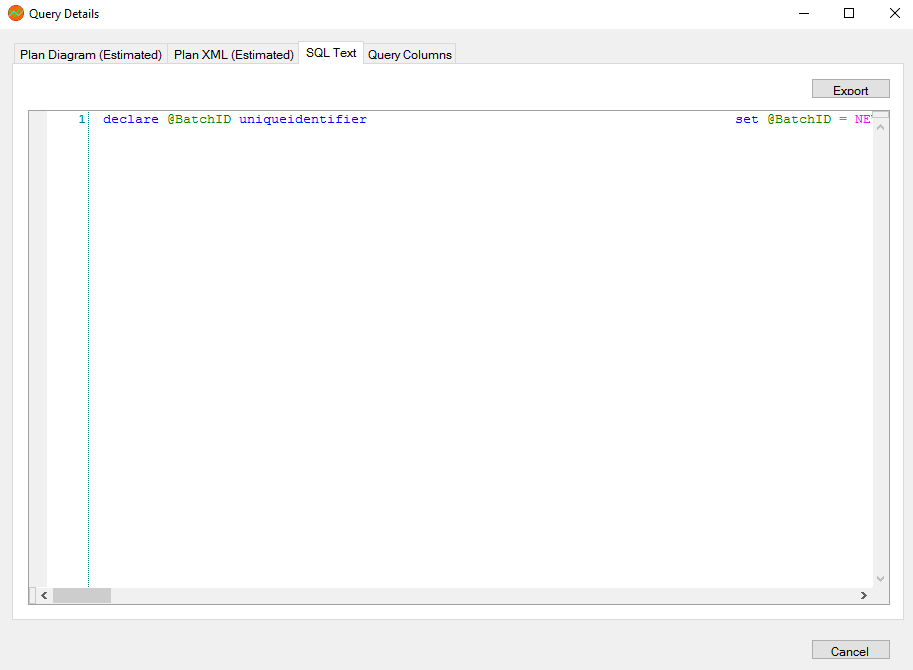
In the SQL Text view you can perform the following actions:
- Export and save SQL Text for review.
- Access the Plan Diagram, Plan XML, and Query Columns tabs.
| Anchor | ||||
|---|---|---|---|---|
|
The Query Columns tab of the Query Details window shows all the referenced columns for the query execution plan.

In the Query Columns view you can perform the following actions:
- Export and Save information to a text file.