Page History
6.1 Start Debugging
You can start the debug of a compiled LANSA program using one of the following:
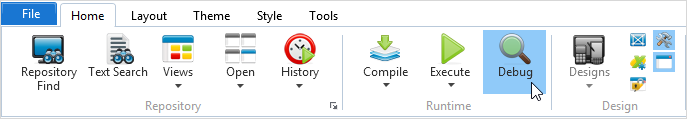
- The Debug command in the ribbon:
...
- The debug and start option from a context menu in the Repository Tab or the Favorites Tab
- The debug parameter when specifying the Additional Execution Parameters
When the object to be debugged is executed, it is opened in the editor. If no breakpoints are set, the debug session immediately stops at the first executable line so you can set breakpoints or start stepping through the code.
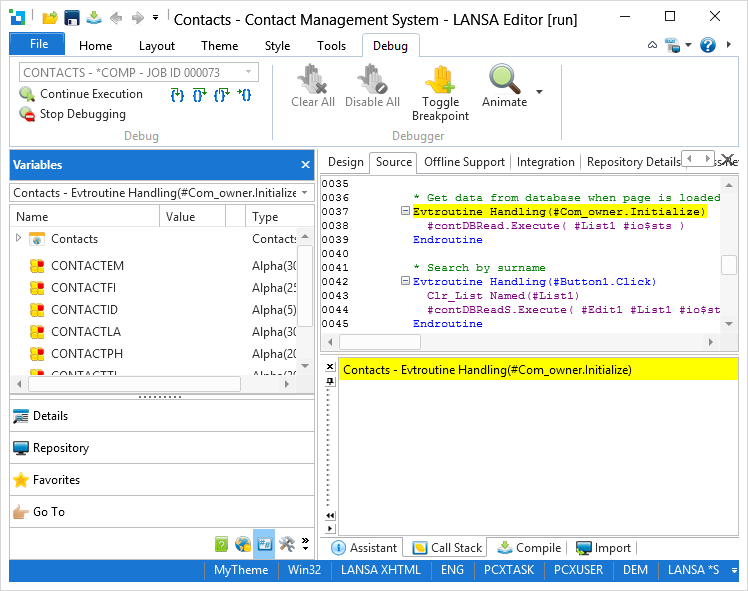
By default, lines with enabled breakpoints are shown in red and the active debug line is shown in yellow.
Disabled breakpoints are shown in gray.
Debugger Commands
| Continue execution of the program (F5). |
| The program execution in debug is cancelled. |
| Step Into (F8). Refer to 6.5 Run Parts of the Application. |
| Step Over (Shift + F8). Refer to 6.5 Run Parts of the Application. |
| Go back to the calling procedure. Refer to 6.5 Run Parts of the Application. |
| Execute the program and break at the current cursor line even if not marked as a breakpoint. Note: All breakpoints before the cursor line will be used. |
| Insert a breakpoint on the selected line, or if a breakpoint already exists, remove it from the line. |
| Clear all breakpoints. |
| Disable all breakpoints. |
| Animate. See 6.7 Animate Application Execution. |


...