Page History
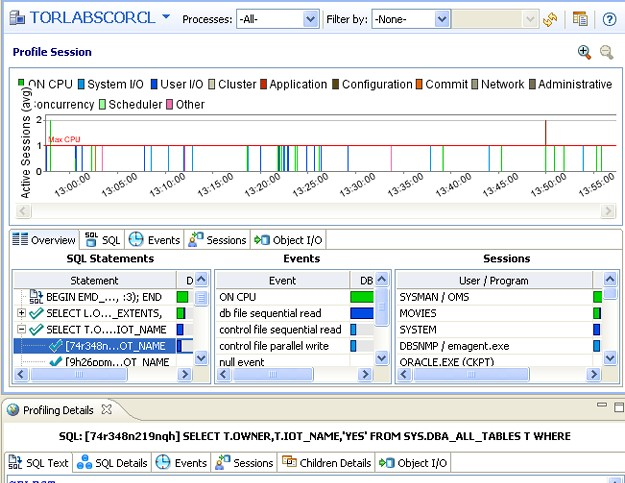
Profiling is monitored and managed via profiling’s three major interface components: the Load Chart, Top Activity Section, and Profiling Details view.
To execute a profiling session
...
In the above command, the user has specified ROM*L*ABORCL10G_1 as the data source, and indicates a profiling session of 20 minutes. The tofile variable specifies the directory and name of the file to which the profiling session will be saved.