Page History
IDERA Web Console is comprised of two main sub- views:
These sub-views display all data collected at the last refresh for all your monitored SQL Server instances. To access any sub-view, click the appropriate button in the left panel of the dashboard as shown in the following image:
Anchor thumbnail thumbnail
Thumbnail
| thumbnail | |
| thumbnail |
...
view
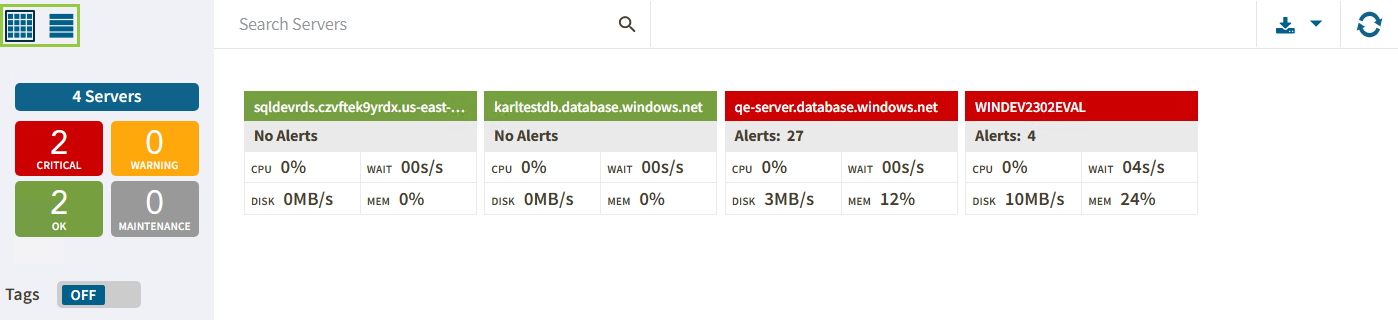
The thumbnail sub-view is the default view in the IDERA Web Console and provides you with a graphical replication of your monitored SQL servers. Access additional details in the single instance view by clicking on a thumbnail instance.
...
The thumbnail sub-view displays basic statistics about your SQL Servers:
Server Name
Displays the server name. The IDERA Web Console only displays 30 characters in the thumbnail. If the name is longer, you can see the entire name by hovering the mouse over the card.
Alerts/No Alerts
Displays the number of triggered alerts in the instance according to the state of the card.
...
For example, if the card is critical, the Alert field will show only the number of critical alerts.
Blocked Status
Displays a BLOCKED or BLOCKING red message next to the Alert field when the server is blocking or is blocked by another.
CPU
Refers to the average percentage of SQL Server processor usage on the computer hosting the SQL Server instance.
Wait
Displays the Total Server Waits for the monitored SQL Server instance
...
Disk
...
Refers to the number of physical reads and physical writes made by the SQL Server instance between refreshes.
...
Mem
Refers to the amount percentage of allocated memory in use by the monitored SQL Server instance.
Anchor List List
| List | |
| List |
...
List view
The details sub-view offers a means to quickly identify the status of instances, as well as the possibility to navigate to the single instance dashboard when clicking on a specific row.
...