Page History
On the Analyze tab, in the History group , you can access the results of every analysis stored by SQL Diagnostic Manager for your monitored SQL Server instance.
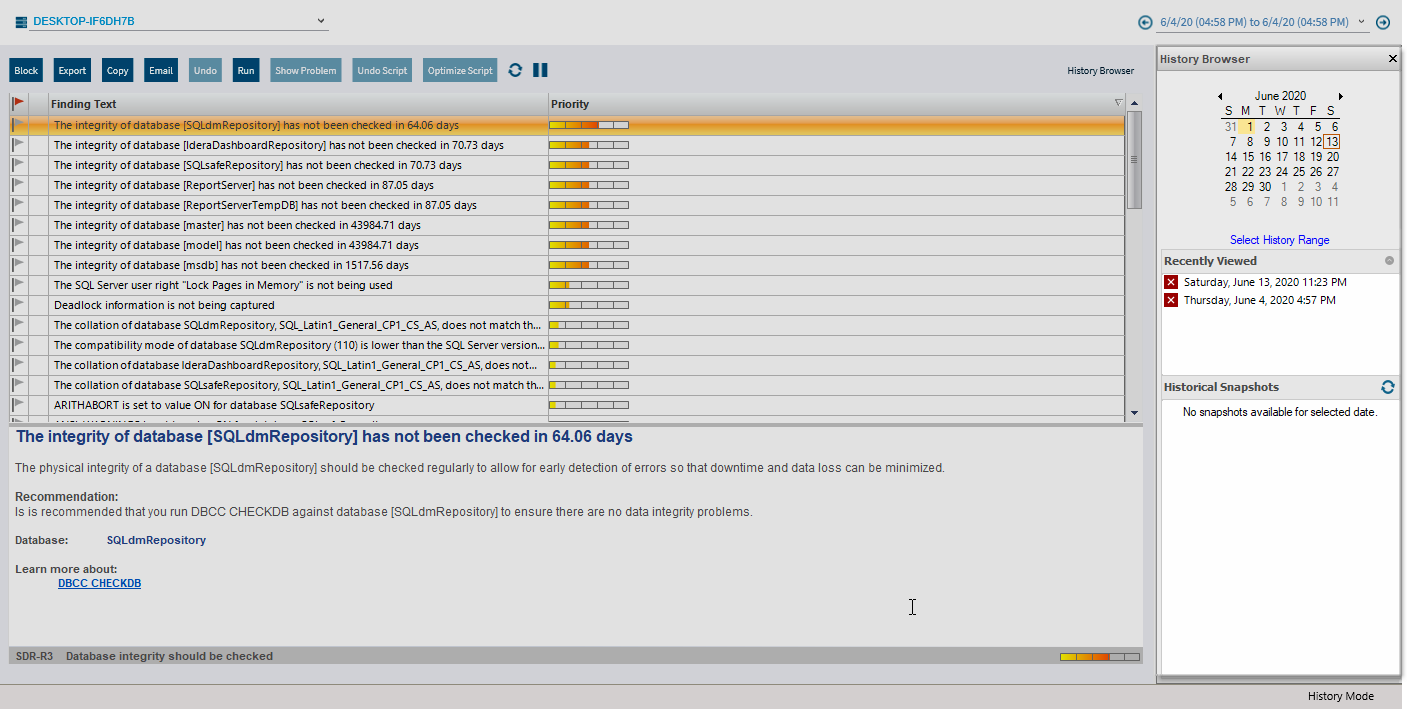
Analyses are ordered by start time per the local computer running the SQL Diagnostic Manager console, and include:
- Time stamp when the analysis started.
- Total number of recommendations found.
- Highest priority recommendation associated with the analysis.
To select a specific analysis:
- Open the History Browser.
- Select the date from the calendar.
- Select the corresponding analysis from the Historical Snapshots list.
Additional actions
Previous Analysis
Browse to the previous analysis result of your SQL Server instance.
Next Analysis
Browse to the next analysis result of your SQL Server instance.
| Tip |
|---|
To return to Real-Time mode, click Run Analysis on the Analyze tab. |