When configuring your analysis, you can select any combination of performance categories to focus the analysis. Each category contains a set of performance metrics and their related recommendations. By picking a category, you are identifying which SQL Server areas concern you most.
Based on the chosen categories, SQL Diagnostic Manager polls your target SQL Server instance to gather the appropriate metrics and determine which recommendations match the current performance issues.
To run an analysis:
- Click Run Analysis in the Analyze tab.
- When the Run Analysis window opens, you can select all the categories depending on what you want to include in your analysis. In the Filters tab, you can include specific applications (% wildcard), limit your analysis to a single database, and set how long SQLDM should spend collecting diagnostic data.
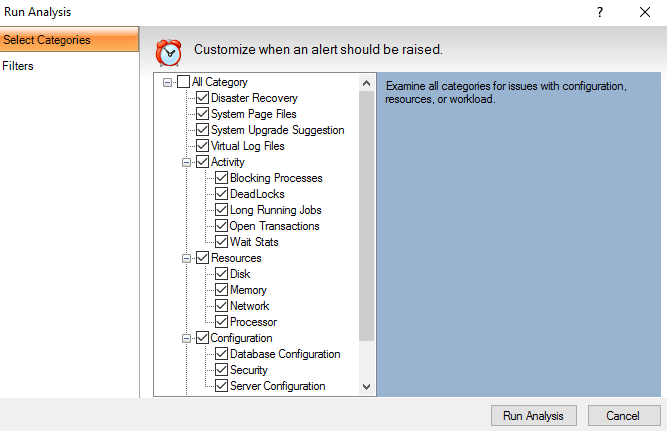
- Once you are finished with the Analysis configuration, click Run Analysis to start with the Analysis, or click Cancel if you want to cancel the Analysis.
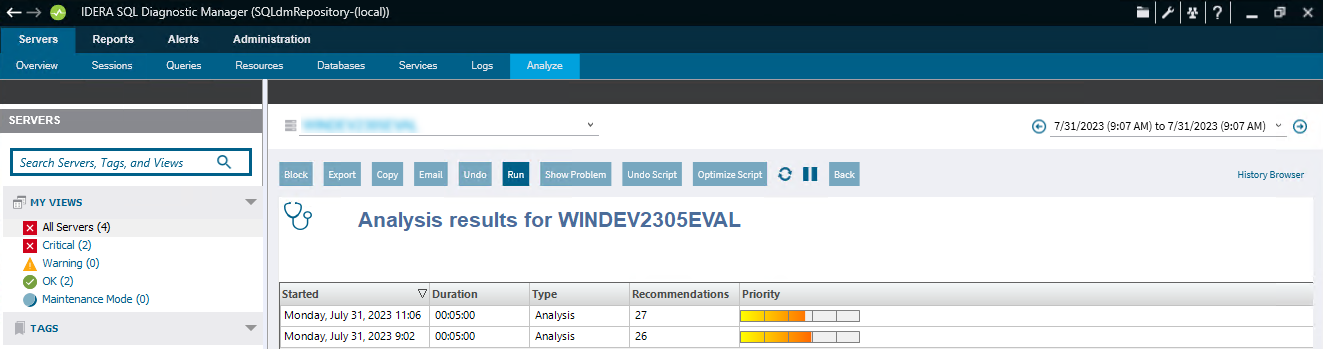
When the analysis is complete, SQL Diagnostic Manager lists all the performed analysis results by date.
Double-click any of the Analyses to review the priority-ranked list of recommendations.
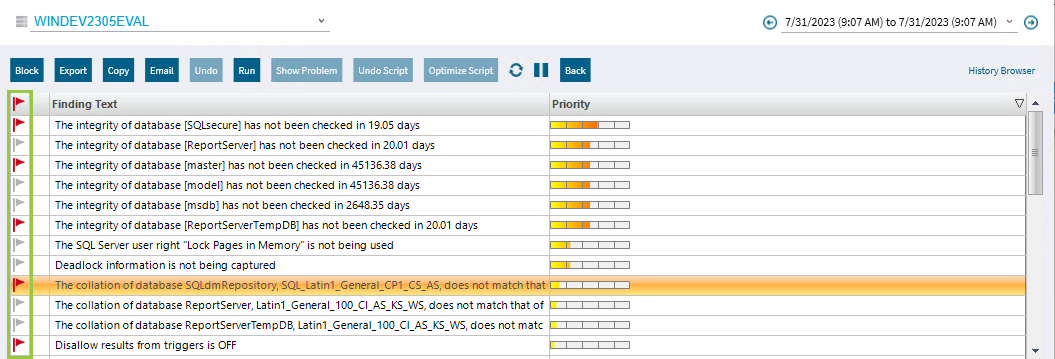
SQLDM lists recommendations by priority. The priority of a recommendation is determined by the performance gain you receive from making the suggested change, and how relevant are the parameters you specified when configuring the analysis.Select a recommendation to have detailed information.
You can set up the Analysis categories, Analysis options, Scheduling, and other Advanced Settings in the Monitored SQL Server Properties window:
- Right-click the appropriate SQL Server instance from the Servers tree and select Properties.
- Select Analysis Configuration when SQL Diagnostic Manager displays the Monitored SQL Server Properties window. For more information, review Configure your prescriptive analysis options.
- Click OK.
Flag a Recommendation
Flagging a recommendation allows you to mark it for follow-up action. Use flags to identify recommendations that require further investigation or that you want to optimize at a later time. When you flag a recommendation, this flagged state is saved to the analysis file, allowing you to easily find the recommendation later.
To flag recommendations, click the Flag icon next to the recommendation you want to flag.
Scripts
Optimize Script
Some recommendation has the Optimize Script option enabled. The Optimize Now window displays the script that was used to enact the recommended change. Review the script, to either Run it or Cancel to return to the recommendation you were viewing.
When you run the Optimize Script, displays next to the optimized recommendation.
You can also copy the script to a Notepad or any other text editor to examine the code and research other options further before making the change.
Undo Script
The Undo Optimization window displays the script that is used to enact the recommended change. Review the script and either click the Run button to initiate the undo or click Cancel to return to the recommendation you were viewing. The undo script can be copied to the clipboard and used at a later time.
Executing the undo script on a recommendation that is not already optimized can harm your SQL Server environment. Before executing the undo script, be sure that the corresponding optimization is performed.
Show Problem
The Show Problem button launches the SQL Viewer window with the SQL text associated with the recommendation highlighted.
Additional actions
Block
Block a particular recommendation or recommendations to fine-tune your analysis.
Export
Export your recommendations in .xls file format.
Copy
Copy your recommendations to the clipboard so that you can view the text in a text editor.
Email
Email your analysis results with recommendations.