Page History
This section includes the following topics:
- About Precise for J2EE workspaces
- How most workspaces are structured
- About drilling down in context
- Tasks common to most workspaces
- About configuring Precise for J2EE settings
| Anchor | ||||
|---|---|---|---|---|
|
The Precise for J2EE user interface is comprised of three workspaces - Dashboard, Activity, and Memory & Statistics. Each workspace has a unique focus, highlighting a specific aspect of the performance of your J2EE applications. You can easily navigate between these workspaces to examine the information necessary to successfully track your system’s performance.
...
Table 1-1 Precise for J2EE workspaces
Workspace Description
...
| Workspace | Description |
|---|---|
| Dashboard | Lets you quickly visualize the overall health and status of all instrumented application server instances. The Dashboard workspace provides support for detailed views of individual application servers, as well as top-level summary views of multiple application servers. |
...
| See “About the Dashboard workspace” on page 19. |
| Activity |
...
| Lets you investigate your JVM execution tree in a deep or shallow manner, and to track SQL execution, locks and exceptions in the same manner. |
...
| See “About the Activity workspace” on page 22. |
| Memory & |
...
| Statistics | Lets you examine Application Server metrics. |
...
| See “About the Statistics workspace” on page 39. |
You can easily switch between the different workspaces using the Workspace Selection bar. See “Switching to a different workspace” on page 14.
| Anchor | ||||
|---|---|---|---|---|
|
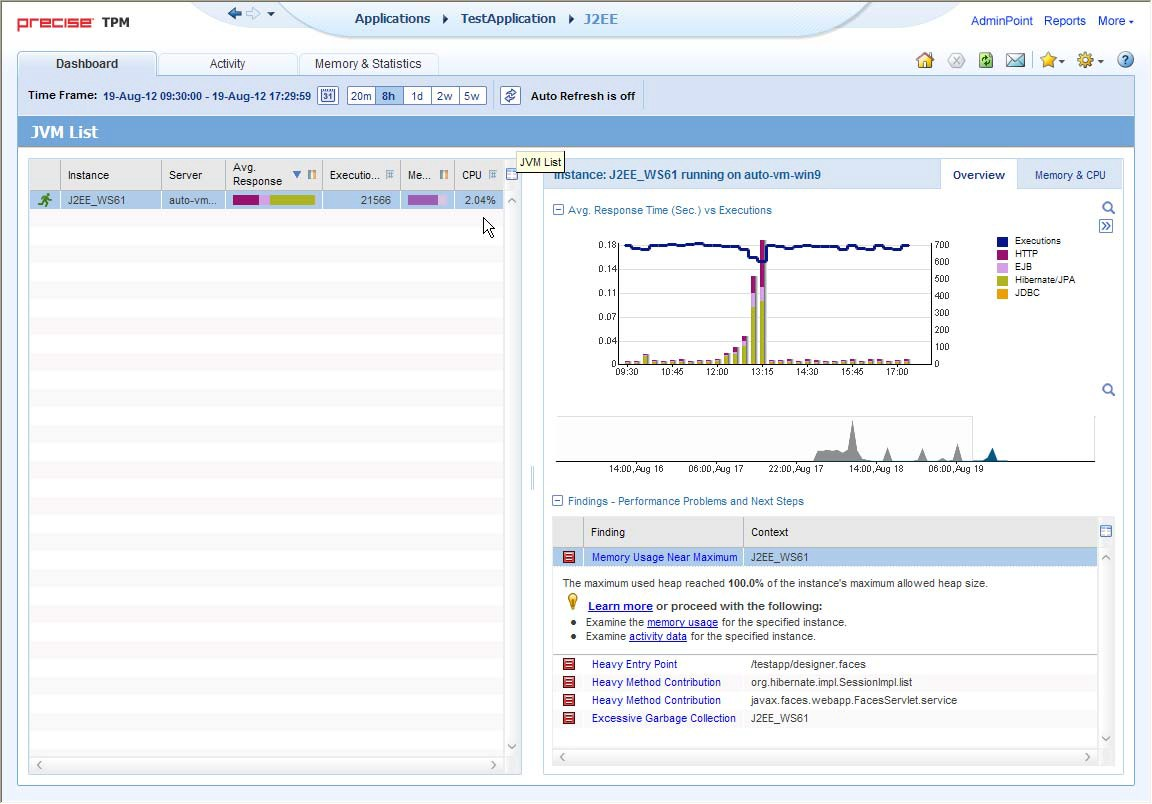
Though each workspace is structured differently, most workspaces consist of a Precise bar, workspace selection bar, workspace bar, and two areas - the Main area and the Association area. The Main area (left or top pane) features either a table or a tree view of all monitored J2EE instances, and the Association area (right or bottom pane) includes various workspace specific tabs that display information in various formats, such as tables, graphs, or charts.
...
Figure 1-1 Sample Dashboard Workspace Structure
About the Precise bar
The Precise bar enables you to keep track of where you have been and provides various controls. The following table describes the function of each of the toolbar buttons.
Table 1-2 Precise bar functions
Icon Name Description
...
| Icon | Name | Description |
|---|---|---|
 | Back | During a work session, keeps track of where you have navigated to. The Back button enables you to navigate between previously visited views. The Back control displays your previous view. |
...
 | Forward | Enables you to navigate to the next view. This button is only enabled if you clicked Back or if you chose a history option. |
...
 | AdminPoint | Opens |
...
| Precise AdminPoint. |
...
 | Home | Navigates to the highest level entity, usually the instance or AppTier (all instances). The time frame settings remain the same. |
...
 | Stop | Stops a request for information from the server. |
...
 | Refresh | Updates the data currently displayed. |
...
 | Favorites | Enables you to add or remove favorites in your Favorites list. |
...
 | Opens |
...
| the Print Option dialog where you can select the area of the screen to print. |
...
 | Opens the default email program with a link in context to the displayed environment. |
...
 | Settings | Opens |
...
one of the following setting configuration: |
...
|
...
|
...
|
...
|
...
|
...
 | Help | Opens the online help in context. |
About the Main area
In most workspaces, the left or top area is the Main area. This area displays an overview of all instances monitored by your Precise product. This information can be displayed in either graph, table, or tree format. The time frame that the information is displayed for can be seen in the workspace toolbar, alongside the selected instance name (and drop-down menu) and auto-refresh status. The times displayed are the local times on the FocalPoint server where the page was generated.
About the Association area
The Association area displays in-depth information for the entity selected in the Main area. Each workspace has analysis tabs specific for that workspace. As you navigate through Precise for J2EE, the analysis tabs change to enable you to view specific information relevant to the selected workspace and entity.
For example, the following analysis tabs are available in the Dashboard workspace:
- Overview
- Memory & CPU
About the Findings area
For selected workspaces in Precise products, the association area includes the Findings area, displaying problematic findings for the application. The findings feature is a high level tool, designed to provide the user with an overview of performance issues within the monitored application and enable quick and efficient navigation to the relevant tab for further analysis and handling. The displayed performance findings may indicate performance deteriorations as well as incorrect methods usage. Each finding appears as a row in the displayed table of findings. Hover the mouse indicator over the single-line displayed finding to expand the finding. When expanded, the finding details area provides important guidelines as to what may be the root cause for the reported problem, and what the recommended steps are to resolve this problem.
...
Table 1-3 Information displayed in the Findings area
Column Description
...
| Column | Description |
|---|---|
| Severity | The severity of the finding is calculated using a formula. The position of the finding in the list is determined by an internal scoring system that is based on the knowledge of Precise product experts. The severity is indicated by the following colors: |
...
|
...
|
...
|
...
By default, findings are displayed according to severity. |
| Finding |
...
| A short name of the Finding. |
| Context |
...
Entity/Method name (unless specified for the whole instance). The entity/method name is a short name but the long name is displayed in the ToolTip. Some of the findings are identified in specific Methods while others are relevant for the entire instance. In the latter case, a finding is specified as an instance-related finding. |
...
|
...
| |
| Finding |
...
| overview | Displays specific details regarding the finding in context. |
...
| ||
| Learn more (advice) |
...
Provides recommendations for solving the selected finding. For each finding, it lists all relevant pieces of advice and all applicable solutions. You should carefully review all data for the finding and then choose the advice that best suits your needs.
|
...
| |
| Proceed with the following (bullets) |
...
Provides expert knowledge about the selected finding. The information displayed will direct you if you have difficulties deciding which advice to take or which solution to implement.
|
...
|
Investigating a finding
Perform the following steps to investigate a finding.
...
For more information, see “Examining findings” on page 49.
| Anchor | ||||
|---|---|---|---|---|
|
The term ‘in-context’ means that you can display additional information on a selected item by drilling down to another workspace or view. The filter settings you defined (for example, the selected time frame you chose) and the entity you selected are carried over to the other view or workspace, to allow you to continue analyzing your subject from a different perspective. This concept takes on slightly different meanings depending upon where you are attempting to drill down in context from. In short, the information displayed when drilling down in context is always related to your original selection’s settings.
...
In short, the information displayed when drilling down in context is always related to your original selection’s settings.
How a drilldown affects the workspace heading
The workspace heading displays the name of the currently selected entity on this screen. When you drill down to a new entity in the Association area, the Workspace heading changes to reflect the name of the newly selected entity.
About viewing data in the Precise for J2EE workspaces
Precise for J2EE workspaces display information in the following formats:
- Bar graphs for a selected time frame.
- Line graphs for a selected time frame.
- Tables for a selected time frame.
| Anchor | ||||
|---|---|---|---|---|
|
The user interface displays data per time slice in bar graphs. Bar graphs summarize one slice of data and generally compare several values of similar type, such as time or throughput. For example, contributors of a higher level metric are displayed as bars in the graph, with their type and percentage work time displayed by putting the mouse over the area of interest (see the “Workspace terminology” figure). Each displayed metric value is an average of observations within the slice.
| Anchor | ||||
|---|---|---|---|---|
|
The user interface displays overtime data for a defined time frame in line graphs. Line graphs summarize many slices of data. You can change the number of items plotted by selecting or unselecting check boxes located to the right of the graph. Each point in the graph represents the total metric value for a time slice included in the time series.
| Anchor | ||||
|---|---|---|---|---|
|
The various Precise for J2EE workspaces display information in tables. The way this information is viewed can be modified according to the user's needs, by clicking on the icon to the right of the column header. The following table describes the displays views available.
...
Bar Graph ( ) This mode displays a solid bar graph for each entity in relative size to the entity with the highest value.
| Anchor | ||||
|---|---|---|---|---|
|
The following tasks are commonly performed in most workspaces:
...
- Click the Export icon.
- Select Export to ASD.
- Insert a name in the name field that clearly describes the graph view.
- Click OK.
| Anchor | ||||
|---|---|---|---|---|
|
The Settings menu on the Precise bar allows you to configure the following:
...