This section includes the following topics:
- About Precise for J2EE workspaces
- How most workspaces are structured
- About drilling down in context
- Tasks common to most workspaces
- About configuring Precise for J2EE settings
About Precise for J2EE workspaces
The Precise for J2EE user interface is comprised of three workspaces - Dashboard, Activity, and Memory & Statistics. Each workspace has a unique focus, highlighting a specific aspect of the performance of your J2EE applications. You can easily navigate between these workspaces to examine the information necessary to successfully track your system’s performance.
The table below describes the three workspaces displayed in Precise for J2EE.
Table 1 Precise for J2EE workspaces
| Workspace | Description |
|---|---|
| Dashboard | Lets you quickly visualize the overall health and status of all instrumented application server instances. The Dashboard workspace provides support for detailed views of individual application servers, as well as top-level summary views of multiple application servers. See About the Dashboard workspace. |
| Activity | Lets you investigate your JVM execution tree in a deep or shallow manner, and to track SQL execution, locks and exceptions in the same manner. See About the Activity workspace. |
| Memory & Statistics | Lets you examine Application Server metrics. See About the Statistics workspace. |
You can easily switch between the different workspaces using the Workspace Selection bar. See Switching to a different workspace.
How most workspaces are structured
Though each workspace is structured differently, most workspaces consist of a Precise bar, workspace selection bar, workspace bar, and two areas: the Main area and the Association area. The Main area (left or top pane) features either a table or a tree view of all monitored J2EE instances, and the Association area (right or bottom pane) includes various workspace specific tabs that display information in various formats, such as tables, graphs, or charts.
The information displayed in one area of the workspace has a direct relation to the information displayed in the other area. When you perform an action on any element in one pane, the information displayed in the other pane changes to reflect this action and to show information for the current selected context.
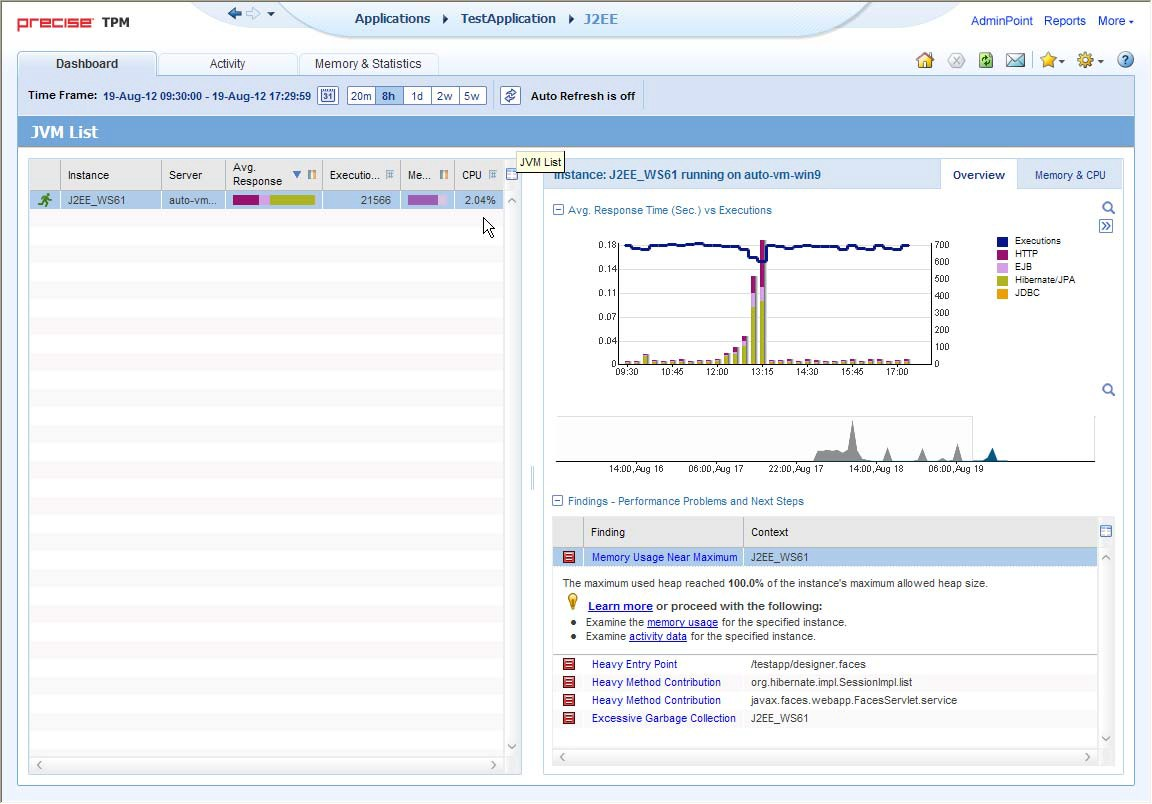
The figure below shows the common workspace elements.
Figure 1 Sample Dashboard Workspace Structure
About the Precise bar
The Precise bar enables you to keep track of where you have been and provides various controls. The following table describes the function of each of the toolbar buttons.
Table 2 Precise bar functions
| Icon | Name | Description |
|---|---|---|
 | Back | During a work session, keeps track of where you have navigated to. The Back button enables you to navigate between previously visited views. The Back control displays your previous view. |
 | Forward | Enables you to navigate to the next view. This button is only enabled if you clicked Back or if you chose a history option. |
 | AdminPoint | Opens Precise AdminPoint. |
 | Home | Navigates to the highest level entity, usually the instance or AppTier (all instances). The time frame settings remain the same. |
 | Stop | Stops a request for information from the server. |
 | Refresh | Updates the data currently displayed. |
 | Favorites | Enables you to add or remove favorites in your Favorites list. |
 | Opens the Print Option dialog where you can select the area of the screen to print. | |
 | Opens the default email program with a link in context to the displayed environment. | |
 | Settings | Opens one of the following setting configuration:
|
 | Help | Opens the online help in context. |
About the Main area
In most workspaces, the left or top area is the Main area. This area displays an overview of all instances monitored by your Precise product. This information can be displayed in either graph, table, or tree format. The time frame that the information is displayed for can be seen in the workspace toolbar, alongside the selected instance name (and drop-down menu) and auto-refresh status. The times displayed are the local times on the FocalPoint server where the page was generated.
About the Association area
The Association area displays in-depth information for the entity selected in the Main area. Each workspace has analysis tabs specific for that workspace. As you navigate through Precise for J2EE, the analysis tabs change to enable you to view specific information relevant to the selected workspace and entity.
For example, the following analysis tabs are available in the Dashboard workspace:
- Overview
- Memory & CPU
About the Findings area
For selected workspaces in Precise products, the association area includes the Findings area, displaying problematic findings for the application. The findings feature is a high level tool, designed to provide the user with an overview of performance issues within the monitored application and enable quick and efficient navigation to the relevant tab for further analysis and handling. The displayed performance findings may indicate performance deteriorations as well as incorrect methods usage. Each finding appears as a row in the displayed table of findings. Hover the mouse indicator over the single-line displayed finding to expand the finding. When expanded, the finding details area provides important guidelines as to what may be the root cause for the reported problem, and what the recommended steps are to resolve this problem.
The table below describes the information that is displayed in the Findings area.
Table 3 Information displayed in the Findings area
| Column | Description |
|---|---|
| Severity | The severity of the finding is calculated using a formula. The position of the finding in the list is determined by an internal scoring system that is based on the knowledge of Precise product experts. The severity is indicated by the following colors:
By default, findings are displayed according to severity. |
| Finding | A short name of the Finding. |
| Context | Entity/Method name (unless specified for the whole instance). The entity/method name is a short name but the long name is displayed in the ToolTip. Some of the findings are identified in specific Methods while others are relevant for the entire instance. In the latter case, a finding is specified as an instance-related finding. Rows are aggregated by finding and the URI/method/SQL name and not by ID. |
| Finding overview | Displays specific details regarding the finding in context. This is displayed in the expanded view only. |
| Learn more (advice) | Provides recommendations for solving the selected finding. For each finding, it lists all relevant pieces of advice and all applicable solutions. You should carefully review all data for the finding and then choose the advice that best suits your needs. This is displayed in the expanded view only. |
| Proceed with the following (bullets) | Provides expert knowledge about the selected finding. The information displayed will direct you if you have difficulties deciding which advice to take or which solution to implement. This is displayed in the expanded view only. |
Investigating a finding
Perform the following steps to investigate a finding.
To investigate a finding
- In the Time Frame list, select the period of time you want to analyze.
- In the All JVMList table, select the instance you want to investigate.
- In the Finding area, review the top Findings for the selected instance displayed in the Findings table. The findings displayed in this table are sorted by severity.
- In the Findings table, select the finding you want to analyze further.
- In the selected finding (the expanded view), read the data displayed for the finding and follow any links provided to view additional information (advice) or next steps (bullets) to resolve the problem.
For more information, see Examining Precise for J2EE findings.
About drilling down in context
The term "in-context" means that you can display additional information on a selected item by drilling down to another workspace or view. The filter settings you defined (for example, the selected time frame you chose) and the entity you selected are carried over to the other view or workspace, to allow you to continue analyzing your subject from a different perspective. This concept takes on slightly different meanings depending upon where you are attempting to drill down in context from. In short, the information displayed when drilling down in context is always related to your original selection’s settings.
For example, when viewing information on an instance in the Dashboard workspace, you can click a link in the Details area (right pane) to view additional information on the related workspace, in context of your original selection.
Or when viewing a list of alerts for your product in Alerts, you can open your product in context and continue investigating the factors that led the system to issue that alert.
In short, the information displayed when drilling down in context is always related to your original selection's settings.
How a drilldown affects the workspace heading
The workspace heading displays the name of the currently selected entity on this screen. When you drill down to a new entity in the Association area, the Workspace heading changes to reflect the name of the newly selected entity.
About viewing data in the Precise for J2EE workspaces
Precise for J2EE workspaces display information in the following formats:
- Bar graphs for a selected time frame
- Line graphs for a selected time frame
- Tables for a selected time frame
Bar graphs for a selected time frame
The user interface displays data per time slice in bar graphs. Bar graphs summarize one slice of data and generally compare several values of similar type, such as time or throughput. For example, contributors of a higher level metric are displayed as bars in the graph, with their type and percentage work time displayed by putting the mouse over the area of interest (see the Workspace terminology figure). Each displayed metric value is an average of observations within the slice.
Line graphs for a selected time frame
The user interface displays overtime data for a defined time frame in line graphs. Line graphs summarize many slices of data. You can change the number of items plotted by selecting or unselecting check boxes located to the right of the graph. Each point in the graph represents the total metric value for a time slice included in the time series.
Tables for a selected time frame
The various Precise for J2EE workspaces display information in tables. The way this information is viewed can be modified according to the user's needs, by clicking on the icon to the right of the column header. The following table describes the displays views available.
Table 4 Column display modes in tables
| Display Mode (Icon) | Description |
|---|---|
Normalized Graph (  ) ) | This mode displays the breakdown bar in full size for each entity. In this mode you can clearly see the relative breakdown per type for each entity in the table. |
Stacked Bar Graph (  ) ) | This mode displays a normalized view of the breakdown bar for each entity in relative size to the entity with the highest value. In this mode, you can see the actual breakdown per type (in seconds) for each entity. |
Numerical (  ) ) | This mode displays the numerical value in the relevant unit size. |
Bar Graph (  ) ) | This mode displays a solid bar graph for each entity in relative size to the entity with the highest value. |
Tasks common to most workspaces
The following tasks are commonly performed in most workspaces:
- Switching to a different workspace
- Selecting a time frame
- Selecting an instance
- Auto Refresh data
- Associating entities with data that meets specific criteria
- Focusing on information in overtime graphs
- Determining which table columns to display
- Adding, viewing, and deleting Favorites
- Exporting to Precise Custom Portal
Switching to a different workspace
You can easily switch between the different workspaces using the Workspace Selection bar. When you start your Precise product, usually the Dashboard workspace opens by default. To select a workspace, click a button on the Workspace Selection bar to display information on the selected entity in a different workspace.
Selecting a time frame
You can configure Precise for J2EE to display transaction performance data for a specific time frame using the predefined time frame options or calendar icons.
Selecting a predefined time frame from the toolbar displays transaction performance data for the selected time period up to the current time. See Selecting a predefined time frame from the Precise for J2EE toolbar.
Selecting the time frame using the calendar icon, you can choose to define a time range independent of the current time, or to define a time range up to the current time. See Selecting a time frame using the calendar icon.
The predefined time frame options are:
- Last 20 minutes (20m) (default)
- Last 8 hours (8h)
- Last 1 day (1d)
- Last 2weeks (2w)
- Last 5 weeks (5w)
The time frame selected affects all information displayed in Precise for J2EE. Only data that falls within the selected time frame is shown in these areas.
Selecting a predefined time frame from the Precise for J2EE toolbar
To select a predefined time frame, from the Precise for J2EE toolbar, select one of the predefined time frames.
Selecting a time frame using the calendar icon
To select a time frame
- Click the calendar icon. In the dialog box that is displayed perform one of the following:
- To define a time frame independent from the current time, select Time Range, and the select the Start and End dates and times.
- To define a time frame up to the current time, select Last, and then enter the desired time frame.
- To use one of the three previously used time frames, select Recently used, and then from the drop-down menu, select the desired time frame.
- To use a previously saved time frame, select Use a previously saved time frame, and then from the drop-down menu, select the desired time frame.
- To save your settings for future access, select Save these definitions for future use as: and enter a name in the corresponding field.
- Click OK.
Selecting an instance
You can select a specific instance to examine in more detail. To select an instance, in the Instance field (located to the right of the Time frame), select the instance you want to examine from the drop-down list.
Auto Refresh data
You can configure Precise for J2EE to automatically refresh collected data displayed on a workspace. By default the option is Auto Refresh is off. To Auto Refresh data, click Auto Refresh is off/Auto Refresh is on.
Associating entities with data that meets specific criteria
You can associate the displayed entity with specific data to focus your analysis.
The criteria no longer apply when you drill down to another entity.
To associate entities with data that meets specific criteria
- Click the arrow located to the left of the Association controls and select More...
- In the Associate With dialog box, in the Entries tab, select the entity you want to associate data with from the Populate table with list.
- In the Sort entries by list, determine which criteria you want the information to be sorted by and in which order.
- From the Display top list, select the number of rows to display.
- On the Criteria tab, do the following for each entity you want to associate data with:
- From the left drop-down list, select an entity.
- From the middle drop-down list, select an operator, such as, Like, <>, Not Like, In, Not In.
- In the text box, type the criteria (case-sensitive for the selected entity.
If you select the operator Like or Not Like, you can use the % wildcard character to represent 0 or more characters, and the _ wildcard character to represent exactly one character. If you select the operator In or Not In, type a comma to separate values.
- Click OK.
Focusing on information in overtime graphs
Some entities display an overtime graph. The overtime graph displays activity statistics over a specified time period. Depending on the number of points displayed in the graph, you may need to zoom in or out. The text displayed on the x-axis varies according to the time frame. If there is a year or day change, x-axis labels will display accordingly.
Use the vertical or horizontal scroll bars (if displayed) to view additional information on the graph. Click the double-arrow (>>) icon to either hide or show the overtime graph legend.
Use the small zoom (spyglass) icon, displayed on the upper right of a time range and above the overtime graph legend, to select a desired time frame that you wish to focus. To select an area on the graph, first click and drag the mouse pointer and then click the spyglass icon.
Determining which table columns to display
Tables are used to display information about a set of related entities in either the left or right panes. It is possible to determine which columns to display in the Association area tables.
To determine which columns to display in a table
- Click the Table icon on the upper right-hand side of a table and select Column Chooser.
- In the Column Chooser dialog box, click the arrows to move the names of the columns that you want to display to the Visible box and the ones that you do not want to display to the Invisible box.
- Click OK.
Sending an email message
You can send an email message to one or more recipients from the Precise toolbar. The default message subject is, "Link to a Precise environment." The email will include a link to the Precise product in the current context (time frame and selected entries).
To send an email message
- Click the email icon on the Precise toolbar. The default email program opens.
- Fill in the required fields and click Send.
Adding, viewing, and deleting Favorites
The Favorites function enables you to save a specific location in your environment and to retrieve the same location later without having to navigate to it. For this purpose, a friendly user interface similar to the familiar Favorites option in the Internet Explorer is implemented.
About the Favorites function
The new Favorites function includes the following features:
- Relative Time Frame. Saving a relative time frame instead of static date. For example, saving the last seven days will always display the last seven days, depending on the day entered.
- One click to specific location. Once you open Precise by launching a saved Favorite item, you will not have to enter a login credential nor click the login button.
- IE Favorites support. Adding a new Favorite item in Precise will also add it to the IE Favorites menu.
- Auto Complete. The Favorites dialog includes a new combo box which supports AutoComplete.
- Auto Naming. The Favorites dialog generates item names based on the current location.
UI description
An Add/Delete Favorites option under the Favorites menu allows you to save the current location or delete an existing one.
To add a new Favorite location
- On the Add/Delete Favorites dialog box, enter the name of the new Favorites entry.
- Click Add. The dialog box is closed and the new Favorite is added to the list.
To view a Favorites location
- On the Precise bar, click Favorites.
- Select the Favorites location you want to view.
To delete an existing Favorite location
- On the Add/Delete Favorites dialog box, select the Favorite location to be deleted.
- Click Delete. The dialog box closes and the selected Favorite is deleted from the list.
You cannot edit the favorite address appearing in the Address field.
Exporting to Precise Custom Portal
The Export to Precise Custom Portal Portlet feature enables you to export the view of the chosen table or graph and generate a portlet with that view in Precise Custom Portal, so that it will provide you with another way of monitoring your environment.
Prerequisites
To be able to use this feature, you need to have the following rights in Precise:
- View permissions to all AppTiers in the environment
If you do not have sufficient rights, you will get an error message when trying to execute this feature.
Exporting the information
You can either export a table view or a graph view.
The name field has the following restrictions: maximum 100 characters.
To export a table view
- Click the Column Chooser icon.
- Select Export to Precise Custom Portal portlet.
- Insert a name in the name field that clearly describes the table view.
- Click OK.
To export a graph view
- Click the Export icon.
- Select Export to ASD.
- Insert a name in the name field that clearly describes the graph view.
- Click OK.
About configuring Precise for J2EE settings
The Settings menu on the Precise bar allows you to configure the following:
- Monitor Settings
- Tree View Setting (Activity workspace only)
- Display Settings
- Time Frame Settings
- Dynamic Types Allocation
To configure any of the above-named settings
- On the Precise bar, click Settings.
- Select the setting type (from the menu) you want to configure.
- On the appropriate settings dialog box, enter your configuration choices. See Configuring Precise for J2EE settings.
Launching Precise for J2EE from Precise StartPoint
The Precise user interface is a server-side Java application that listens on a network port for HTML page requests. The syntax of the Precise URL address is:
http://<server machine>:<port>/
where <server machine> refers to the Precise FocalPoint server and <port> refers to the port number that the FocalPoint communicates on. By default, the port number is 20790.
The Precise FocalPoint and Precise for J2EE FocalPoint must be started before they can be accessed. See the Precise Administration Guide to learn how to start Precise and Precise for components.
To access the Precise for J2EE user interface using Precise StartPoint
- Type the URL address of the StartPoint user interface into the Address bar of your browser and press Enter. The Precise login page opens. The login page provides secure access to Precise and to your specific product.
- Specify your authorized role name and password. By default, both the role name and password are
admin. For more information on role names, see the Precise Administration Guide. - Click Login. The StartPoint page opens. This is the Precise home page.
- On the StartPoint page, click the Experts TPM icon on the top right side and select J2EE.
- Precise for J2EE opens to the Dashboard workspace.