This section includes the following topics:
About the Dashboard workspace
The Precise for J2EE Dashboard workspace provides a comprehensive overview of the health and status of all instrumented application server instances, based on the data collected according to the application instrumentation. The information displayed in this workspace pinpoints performance trends and issues in your application and offers clear navigational recommendations throughout Precise for J2EE for further analysis and handling.
See About the Activity workspace and About the Statistics workspace.
How the Dashboard workspace is structured
The Dashboard workspace is divided into two (left and right) panes. The Main area (left pane) displays a list of all the instances monitored by Precise for J2EE and compares them in terms of performance and resource usage. The Association area (right pane) contains two tabs, each displaying overtime graphs of the instances' behavior. The Association area also features the Findings table, providing specific details regarding performance issues and advice for further analysis.
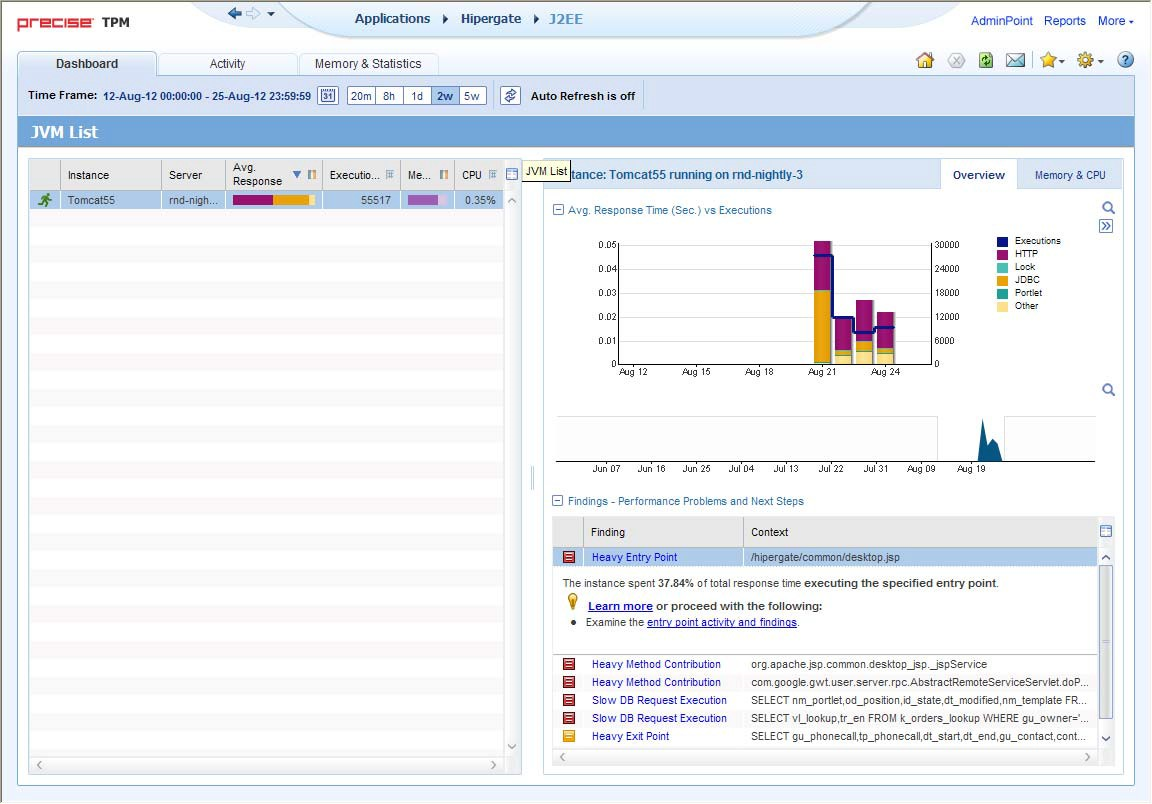
The figure below shows a typical Dashboard workspace.
Figure 1 Typical Dashboard workspace
About the Main area in the Dashboard workspace
The Instance (JVM) table in the Main area (left pane) lists all instances monitored by Precise for J2EE. Each row corresponds to an instance. The All row summarizes the activities of all monitored instances.
The following table describes the information displayed for the different instances (JVMs) in the environment, and is sorted alphabetically by instance by default.
For more information regarding viewing the displayed data, see Tables for a selected time frame.
Table 1 Instance table
| Column | Description |
|---|---|
| Status icon | Indicates one of four possible instance availability states:
|
| Instance | Name of the instance (JVM). |
| Server | Name of the server on which the instance runs. |
| Avg. Response Time (Sec) | Average time it took to process a service request for a specific instance. |
| Executions | Total number of executions during the selected time frame. |
| Memory | Average amount of memory used by all the executions of the instance during the selected time frame. |
| CPU | Average percentage of CPU time used by the instances during the selected time frame. |
| Availability | Average percentage of time that the instance was available within the selected time frame. |
| SLA Compliance | Indicates the extent to which HTTP entry point service requests complied with the instance’s predefined SLA thresholds. |
About the Association area in the Dashboard workspace
The Association area in the Dashboard workspace contains two tabs, providing a performance trends overview and resource consumption information for the selected instance.
The following tabs appear in the Dashboard workspace:
The overtime graphs display instance or entity statistics for the selected time frame. Depending on the number of points displayed in the graph you may want to zoom in or out.
About the Overview tab
The Overview tab displays overtime graphs and a findings table, providing the user with an overview of the performance of all instances, or a selected instance, in the selected time frame.
The information displayed in the Overview tab includes:
- Avg. Response Time (Sec) vs Executions. An overtime graph displaying a breakdown, by type, of the average response time for the instance, relative to the number of executions.
- Overtime trends. An overtime graph displaying the performance trends for the instance. The performance trends for the instance in the selected time frame are shown in color, and the performance trends for the instance in the previous and (if applicable) following time frame are shown in grayscale. This view provides the user with a greater overtime perspective of the instance’s performance patterns and behavior.
- Findings table. A table listing the findings detected in the selected time frame, displayed in order of severity. For more information, see About the Findings area.
About the Memory & CPU tab
The Memory& CPU tab displays overtime graphs, providing the user with an overview of the selected instance’s resource consumption in the selected time frame.
Information displayed in this tab can only be displayed for a specific instance. Selecting All in the instances table in the Main area will display an empty graph area and a message prompting you to select a specific instance.
The information displayed in the Memory & CPU tab includes:
- Heap Usage. An overtime graph displaying the breakdown of available and used heap. The overtime graph also shows JVM start and restart occurrences.
- CPU Consumption. An overtime graph displayed the CPU consumption rate. The overtime graph also shows when the JVM starts running or is refreshed.