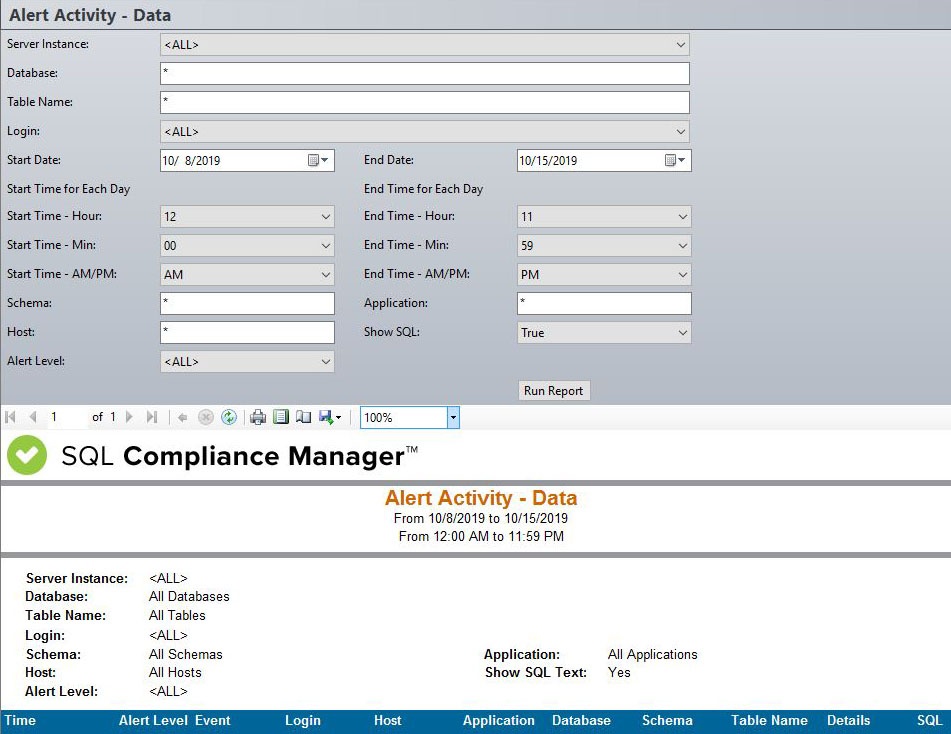
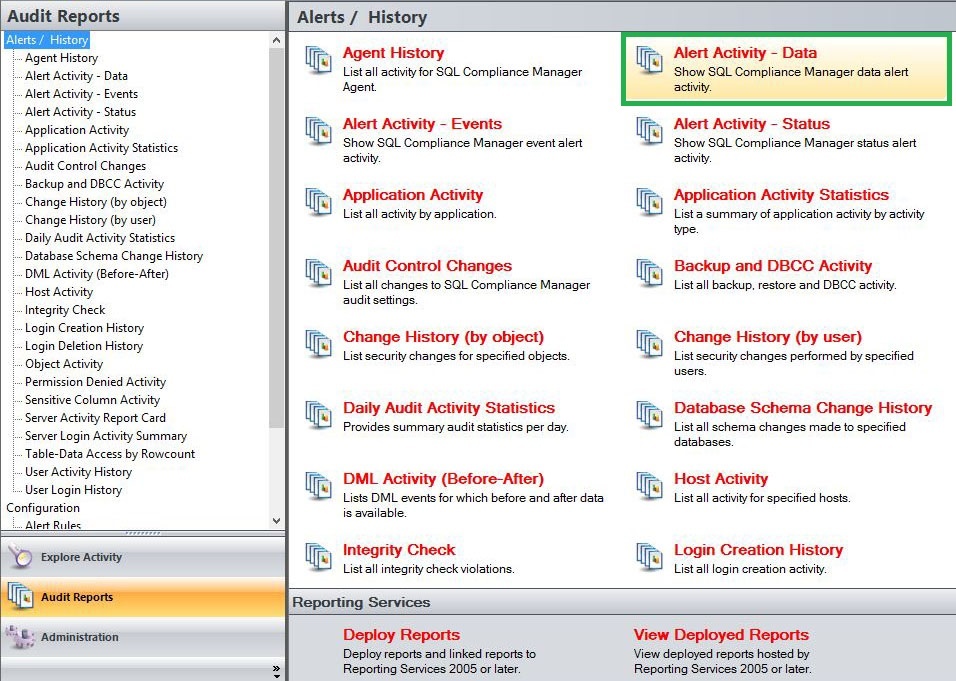
The Alert Activity - Data Report shows SQL Compliance Manager data alert activity in your monitored environment. Use this report to identify and investigate data manipulation on specific databases, tables, or columns.
A filter can include a list of wildcards, separated by commas, where a wildcard is a string, which may contain asterisks. The following parameters are specific to the selected report and enable you to filter the data to include in the report.
Available actions
Server Instance
Allows you to select a registered instance on which you want to report. Select ALL to report on all instances.
Databases
Allows you to select or type the name of one or more databases on which you want to report.
Table Name
Allows you to select or type the name of one or more table names on which you want to report.
Login
Allows you to select the login from the drop down list of available logins. Select ALL to report on all logins.
Start Date
Allows you to select the start date for the range from which you want to report.
End Date
Allows you to select the end date for the range from which you want to report.
Start Time - Hour
Allows you to select the exact starting hour of the day for the range from which you want to report.
Start Time - Min
Allows you to select the exact starting minute of the day for the range from which you want to report.
Start Time - AM/PM
Select between AM or PM from the drop down list to configure the Start Time for Each Day range from which you want to report.
End Time - Hour
Allows you to select the exact ending hour of the day for the range from which you want to report.
End Time - Min
Allows you to select the exact ending minute of the day for the range from which you want to report.
End Time - AM/PM
Select between AM or PM from the drop down list to configure the End Time for Each Day range from which you want to report.
Schema
Allows you to type the name of the schema on which you want to report.
Application
Allows you to type the name of one or more applications on which you want to report.
Host
Allows you to type the name of one or more hosts on which you want to report.
Show SQL
Select between True or False from the drop down menu to filter the report by SQL Text.
Alert Level
Choose to filter alerts by their different levels; Severe, High, Medium, or Low.
Run Report
Click this button to Run the report.
Default columns
Time
The Time column displays the date and time when the event was captured.
Alert Level
The Alert Level column displays the level the alert is configured to.
Event
The Event column provides the name of the audited event that triggered this alert.
Login
The Login column displays the login name of the user who performed the event.
Host
The Host column displays the name of the host.
Application
The Application column displays the name of the application used to capture the event.
Database
The Database column displays the name of the database where the event was captured.
Schema
The Schema column displays the name of the event´s schema.
Table Name
The Table Name column displays the name of the table were the event was captured.
Details
The Details column provides the first line of the alert message associated with this alert.
SQL
The SQL column when set to True, provides the SQL Statement for the captured event.