The Top Table box lists the table names followed by the Wait Time, the number of Operations, the used Space, and the Database name to where they belong.
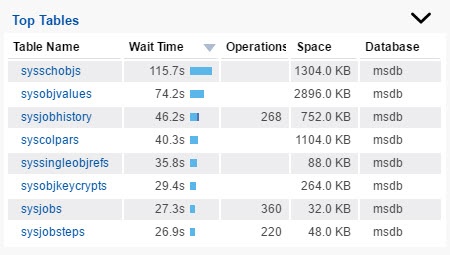
When you click the name of the tables to be redirected to the Table page. The Table page displays the following information:
Summary
The summary box shows an overview of the selected table. It includes the following information: Used Space, Free Space, Table Rows, Avg. I/O Wait Time, I/O Requests, and the partition information.
Wait Time Trending
The Wait Time Trending graph displays the wait time information related to the selected table.
Table & indexes access
The Table & Indexes access shows the table name followed by the type, the Wait Time, the Operations, the used Space, and the Warning.
Currently missing indexes
This box displays the currently missing indexes of the selected table.
Space Allocation Trending
The Space Allocation Trending graph shows the comparison between the Index Free, the Index Used, the Table Free, and the Table Used in KB.
You can drill down the chart to obtain information from a different time frame.
Table access times breakdown
This chart shows the time breakdown .... MORE INFO
Top Statements accessing the Table
This box shows the top statements accessing the selected table. It lists the Statements, the Table Access Time, the Avg. Time, the Executions, and the Database name.
Avg. I/O Wait time Trending
This graph shows the Average I/O Wait time of the selected table. You can drill down the graph to obtain information from a different time frame.
I/O Request trending
This graph shows the I/O Requests of the selected table. You can drill down the graph to obtain information from a different time frame.